PROBLEMS
Question 16.12
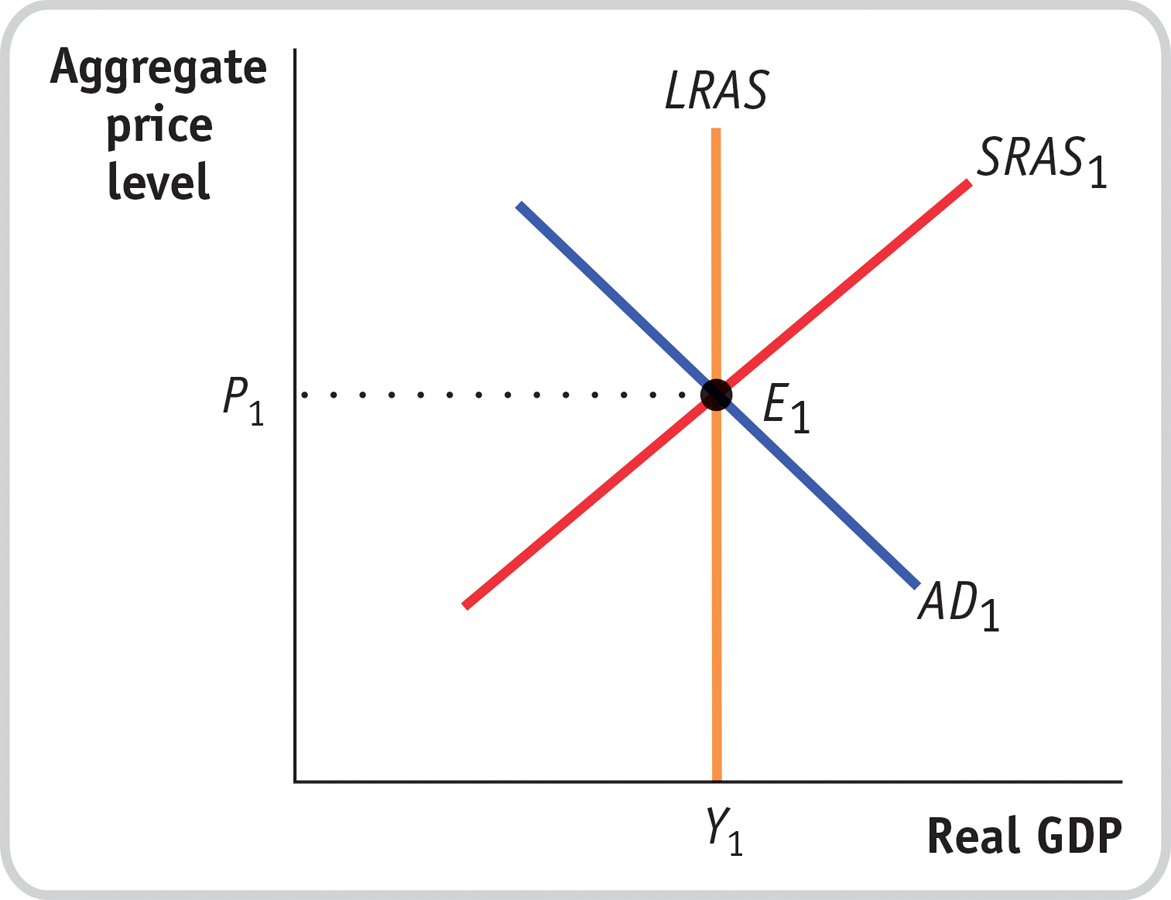
In the economy of Scottopia, policy makers want to lower the unemployment rate and raise real GDP by using monetary policy. Using the accompanying diagram, show why this policy will ultimately result in a higher aggregate price level but no change in real GDP.

Question 16.13
In the following examples, would the classical model of the price level be relevant?
There is a great deal of unemployment in the economy and no history of inflation.
The economy has just experienced five years of hyperinflation.
Although the economy experienced inflation in the 10% to 20% range three years ago, prices have recently been stable and the unemployment rate has approximated the natural rate of unemployment.
Question 16.14
The Federal Reserve regularly releases data on the U.S. monetary base. You can access that data at various websites, including the website for the Federal Reserve Bank of St. Louis. Go to http:/
/research.stlouisfed.org/ and click on “Categories,” then on “Money, Banking, & Finance,” then on “Monetary Data,” then on “Monetary Base,” and then on “Monetary Base; Total” for the latest report. Then click on “View Data.”fred2/ The last two numbers in the column show the levels of the monetary base in the last year. How much did it change?
How did this help in the government’s efforts to finance its deficit?
Why is it important for the central bank to be independent from the part of the government responsible for spending?
Question 16.15
Answer the following questions about the (real) inflation tax, assuming that the price level starts at 1.
Maria Moneybags keeps $1,000 in her sock drawer for a year. Over the year, the inflation rate is 10%. What is the real inflation tax paid by Maria for this year?
Maria continues to keep the $1,000 in her drawer for a second year. What is the real value of this $1,000 at the beginning of the second year? Over the year, the inflation rate is again 10%. What is the real inflation tax paid by Maria for the second year?
For a third year, Maria keeps the $1,000 in the drawer. What is the real value of this $1,000 at the beginning of the third year? Over the year, the inflation rate is again 10%. What is the real inflation tax paid by Maria for the third year?
After three years, what is the cumulative real inflation tax paid?
Redo parts a through d with an inflation rate of 25%. Why is hyperinflation such a problem?
Question 16.16
The inflation tax is often used as a significant source of revenue in developing countries where the tax collection and reporting system is not well developed and tax evasion may be high.
Use the numbers in the accompanying table to calculate the inflation tax in the United States and India (Rp = rupees).
Inflation in 2013
Money supply in 2013 (billions)
Central government receipts in 2013 (billions)
India
9.48%
Rp19,118
Rp10,726
United States
1.46%
$2,832
$3,113
Sources: Bureau of Economic Analysis; Controller General of Accounts (India); Reserve Bank of India; International Monetary Fund; The World Bank.
How large is the inflation tax for the two countries when calculated as a percentage of government receipts?
Question 16.17
Concerned about the crowding-
out effects of government borrowing on private investment spending, a candidate for president argues that the United States should just print money to cover the government’s budget deficit. What are the advantages and disadvantages of such a plan? Question 16.18
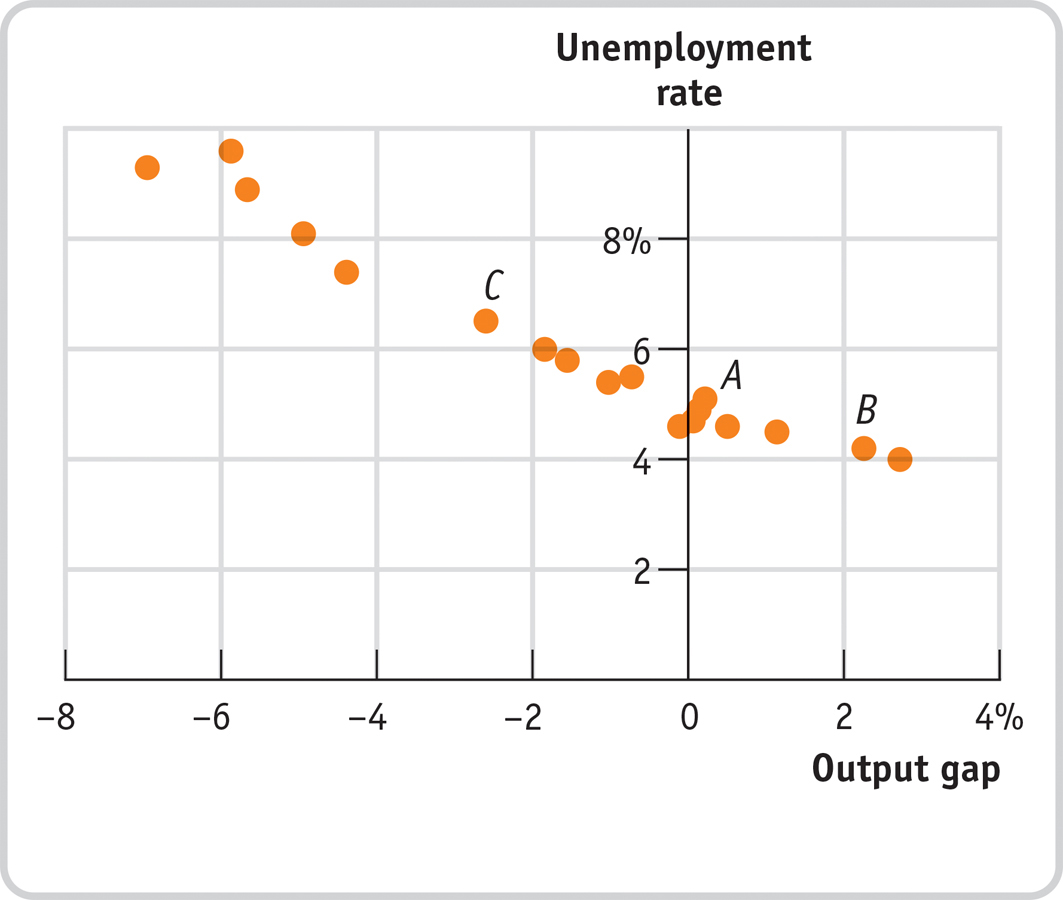
The accompanying scatter diagram shows the relationship between the unemployment rate and the output gap in the United States from 1996 to 2013. Draw a straight line through the scatter of dots in the figure. Assume that this line represents Okun’s law:
Unemployment rate = b − (m × Output gap)
where b is the vertical intercept and −m is the slope
 Source: Federal Reserve Bank of St. Louis.
What is the unemployment rate when aggregate output equals potential output? What would the unemployment rate be if the output gap were 2%? What if the output gap were −3%? What do these results tell us about the coefficient m in Okun’s law?
Question 16.19
After experiencing a recession for the past two years, the residents of Albernia were looking forward to a decrease in the unemployment rate. Yet after six months of strong positive economic growth, the unemployment rate has fallen only slightly below what it was at the end of the recession. How can you explain why the unemployment rate did not fall as much although the economy was experiencing strong economic growth?
Question 16.20
Go to www.bls.gov. Click on link “Subjects”; on the left, under “Inflation & Prices,” click on the link “Consumer Price Index.” Scroll down to the section “CPI Tables,” and find the link “Consumer Price Index Detailed Report, Tables Annual Averages 2009 (PDF).” What is the value of the percent change in the CPI from 2008 to 2009?
Now go to www.treasury.gov and click on “Resource Center.” From there, click on “Data and Charts Center.” Then click on “Interest Rate Statistics.” In the scroll-
down windows, select “Daily Treasury Bill Rates” and “2009.” Examine the data in “4 Weeks Bank Discount.” What is the maximum? The minimum? Then do the same for 2007. How do the data for 2009 and 2007 compare? How would you relate this to your answer in part (a)? From the data on Treasury bill interest rates, what would you infer about the level of the inflation rate in 2007 compared to 2009? (You can check your answer by going back to the www.bls.gov website to find the percent change in the CPI from 2006 to 2007.) How would you characterize the change in the U.S. economy from 2007 to 2009?
Question 16.21
The accompanying table provides data from the United States on the average annual rates of unemployment and inflation. Use the numbers to construct a scatter plot similar to Figure 16-5. Discuss why, in the short run, the unemployment rate rises when inflation falls.
Year
Unemployment rate
Inflation rate
2003
6.0
2.3
2004
5.5
2.7
2005
5.1
3.4
2006
4.6
3.2
2007
4.6
2.9
2008
5.8
3.8
2009
9.3
−0.3
2010
9.6
1.6
2011
8.9
3.1
2012
8.1
2.1
2013
7.2
1.5
Source: Bureau of Labor Statistics.
Question 16.22
The economy of Brittania has been suffering from high inflation with an unemployment rate equal to its natural rate. Policy makers would like to disinflate the economy with the lowest economic cost possible. Assume that the state of the economy is not the result of a negative supply shock. How can they try to minimize the unemployment cost of disinflation? Is it possible for there to be no cost of disinflation?
Question 16.23
Who are the winners and losers when a mortgage company lends $100,000 to the Miller family to buy a house worth $105,000 and during the first year prices unexpectedly fall by 10%? What would you expect to happen if the deflation continued over the next few years? How would continuing deflation affect borrowers and lenders throughout the economy as a whole?
WORK IT OUT
For interactive, step-
Question 16.24
13. Due to historical differences, countries often differ in how quickly a change in actual inflation is incorporated into a change in expected inflation. In a country such as Japan, which has had very little inflation in recent memory, it will take longer for a change in the actual inflation rate to be reflected in a corresponding change in the expected inflation rate. In contrast, in a country such as Zimbabwe, which has recently had very high inflation, a change in the actual inflation rate will immediately be reflected in a corresponding change in the expected inflation rate. What does this imply about the short-