PROBLEMS
Question 6.12
Which of the following questions are relevant for the study of macroeconomics and which for microeconomics?
How will Ms. Martin’s tips change when a large manufacturing plant near the restaurant where she works closes?
What will happen to spending by consumers when the economy enters a downturn?
How will the price of oranges change when a late frost damages Florida’s orange groves?
How will wages at a manufacturing plant change when its workforce is unionized?
What will happen to U.S. exports as the dollar becomes less expensive in terms of other currencies?
What is the relationship between a nation’s unemployment rate and its inflation rate?
Question 6.13
When one person saves more, that person’s wealth is increased, meaning that he or she can consume more in the future. But when everyone saves more, everyone’s income falls, meaning that everyone must consume less today. Explain this seeming contradiction.
Question 6.14
Before the Great Depression, the conventional wisdom among economists and policy makers was that the economy is largely self-
regulating. Is this view consistent or inconsistent with Keynesian economics? Explain.
What effect did the Great Depression have on conventional wisdom?
Contrast the response of policy makers during the 2007–
2009 recession to the actions of policy makers during the Great Depression. What would have been the likely outcome of the 2007– 2009 recession if policy makers had responded in the same fashion as policy makers during the Great Depression?
Question 6.15
How do economists in the United States determine when a recession begins and when it ends? How do other countries determine whether or not a recession is occurring?
Question 6.16
The U.S. Department of Labor reports statistics on employment and earnings that are used as key indicators by many economists to gauge the health of the economy. Figure 6-4 in the text plots historical data on the unemployment rate each month. Noticeably, the numbers were high during the recessions in the early 1990s, in 2001, and in the aftermath of the Great Recession, 2008–
2014. Locate the latest data on the national unemployment rate. (Hint: Go to the website of the Bureau of Labor Statistics, www.bls.gov, and locate the latest release of the Employment Situation.)
Compare the current numbers with those during the early 1990s, 2001, and during 2008–
2014, as well as with the periods of relatively high economic growth just before the recessions. Are the current numbers indicative of a recessionary trend?
Question 6.17
In the 1990s there were some dramatic economic events that came to be known as the Asian financial crisis. A decade later similar events came to be known as the global financial crisis. The accompanying figure shows the growth rate of real GDP in the United States and Japan from 1995 to 2011. Using the graph, explain why the two sets of events are referred to this way.
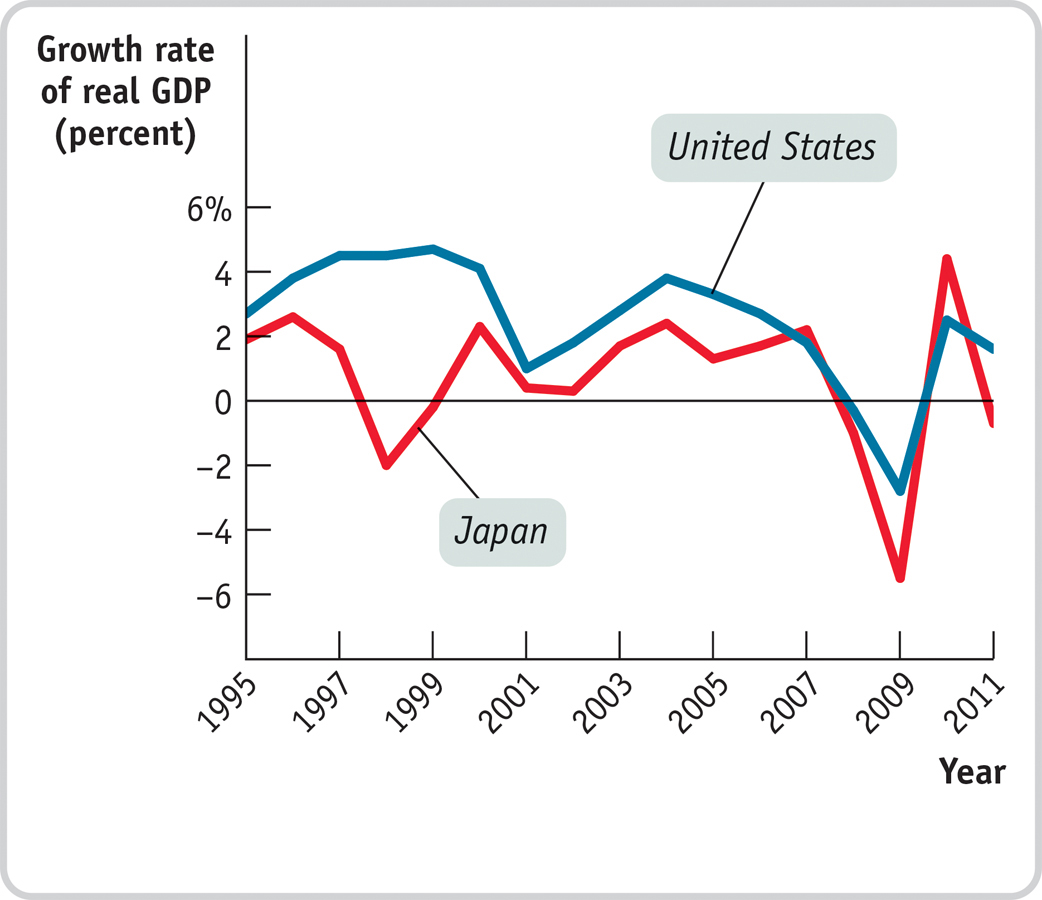 Source: Federal Reserve Bank of St. Louis.
Question 6.18
What three measures of the economy tend to move together during the business cycle? Which way do they move during an upturn? During a downturn?
Who in the economy is hurt during a recession? How?
How did Milton Friedman alter the consensus that had developed in the aftermath of the Great Depression on how the economy should be managed? What is the current goal of policy makers in managing the economy?
Question 6.19
Why do we consider a business-
cycle expansion different from long- run economic growth? Why do we care about the size of the long- run growth rate of real GDP relative to the size of the growth rate of the population? Question 6.20
In 1798, Thomas Malthus’s Essay on the Principle of Population was published. In it, he wrote: “Population, when unchecked, increases in a geometrical ratio. Subsistence increases only in an arithmetical ratio. . . . This implies a strong and constantly operating check on population from the difficulty of subsistence.” Malthus was saying that the growth of the population is limited by the amount of food available to eat; people will live at the subsistence level forever. Why didn’t Malthus’s description apply to the world after 1800?
Question 6.21
Each year, The Economist publishes data on the price of the Big Mac in different countries and exchange rates. The accompanying table shows some data from 2007 and 2014. Use this information to answer the following questions.
2007
2014
Country
Price of Big Mac (in local currrency)
Price of Big Mac (in U.S. dollars)
Price of Big Mac (in local currency)
Price of Big Mac (in U.S. dollars)
Argentina
peso8.25
$2.65
peso21.0
$2.57
Canada
C$3.63
$3.08
C$5.25
$5.64
Euro area
€2.94
$3.82
€3.68
$4.95
Japan
¥280
$2.31
¥370
$3.64
United States
$3.22
$3.22
$4.80
$4.80
Where was it cheapest to buy a Big Mac in U.S. dollars in 2007?
Where was it cheapest to buy a Big Mac in U.S. dollars in 2014?
Using the increase in the local currency price of the Big Mac in each country to measure the percent change in the overall price level from 2007 to 2014, which nation experienced the most inflation? Did any of the nations experience deflation?
Question 6.22
The accompanying figure illustrates the trade deficit of the United States since 1987. The United States has been consistently and, on the whole, increasingly importing more goods than it has been exporting. One of the countries it runs a trade deficit with is China. Which of the following statements are valid possible explanations of this fact? Explain.
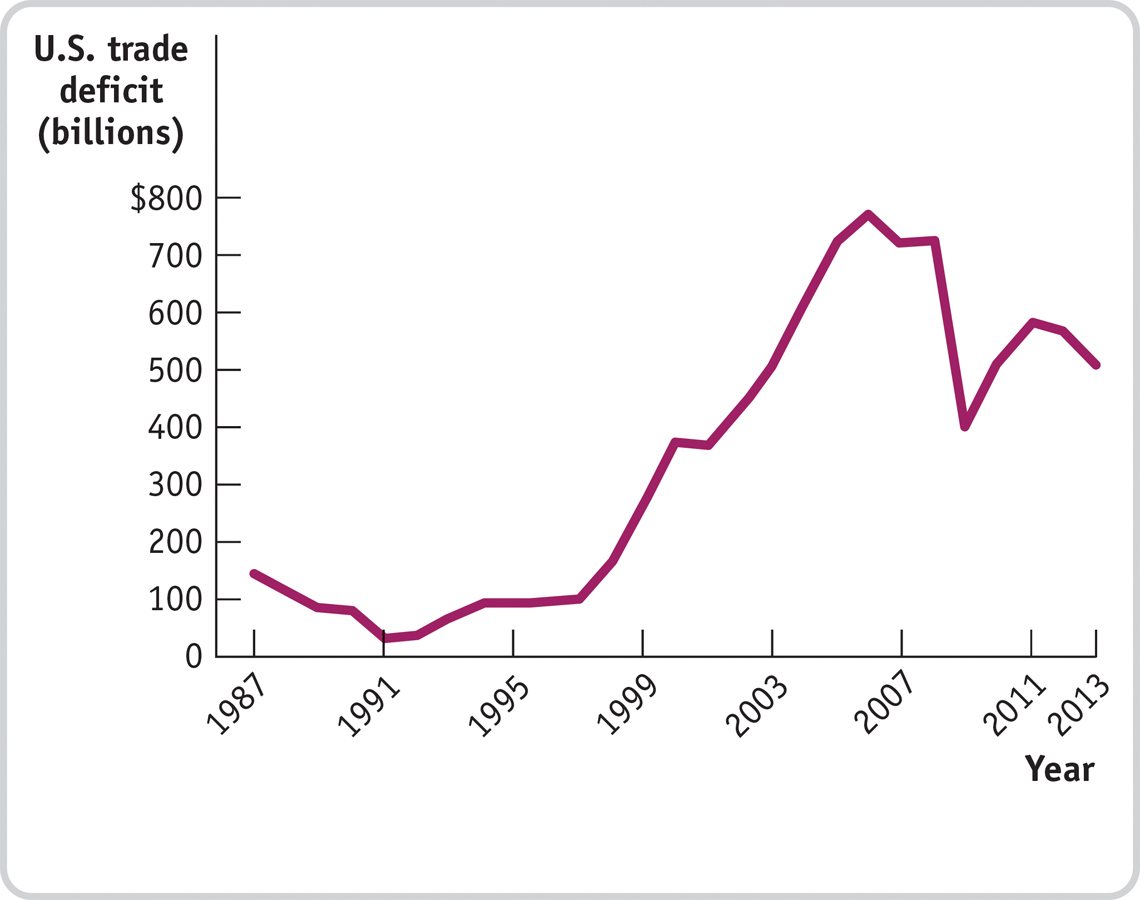 Source: Federal Reserve Economic Data.
Many products, such as televisions, that were formerly manufactured in the United States are now manufactured in China.
The wages of the average Chinese worker are far lower than the wages of the average American worker.
Investment spending in the United States is high relative to its level of savings.
WORK IT OUT
For interactive, step-
Question 6.23
12. College tuition has risen significantly in the last few decades. From the 1981–