The Unemployment Rate
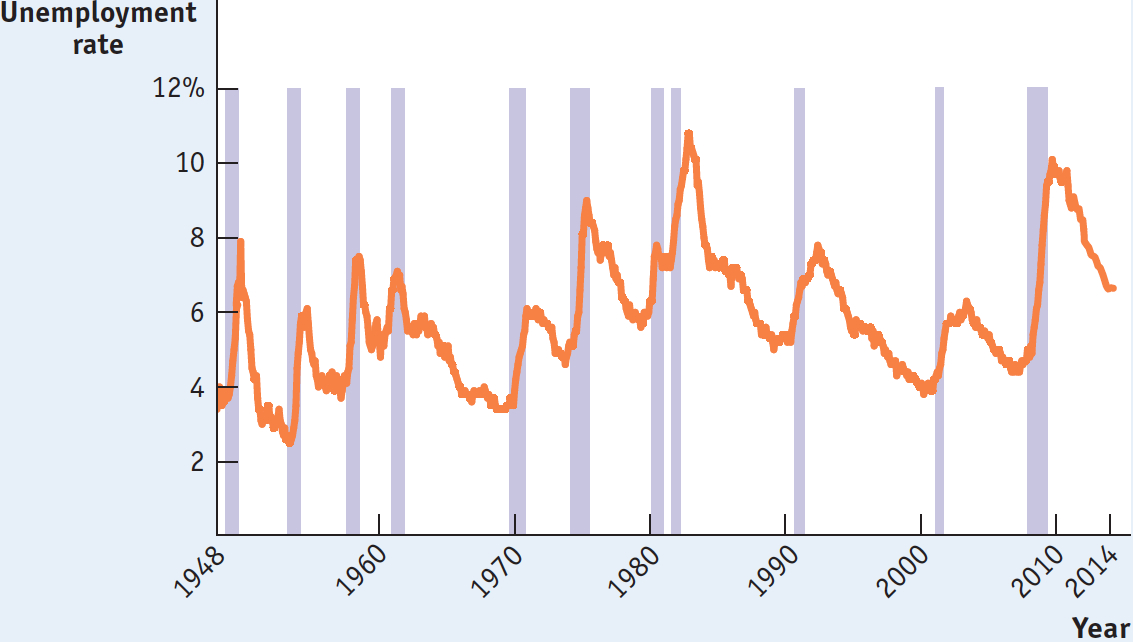
The U.S. unemployment rate in October 2014 was 5.8%. That was a substantial improvement from the situation a few years earlier. In late 2009, after the Great Recession, unemployment peaked at 10%. But unemployment was still well above pre-
Figure 8-1 shows the U.S. unemployment rate from 1948 to late 2014; as you can see, unemployment soared during the Great Recession of 2007–
8-1
The U.S. Unemployment Rate, 1948–
Defining and Measuring Unemployment
Employment is the number of people currently employed in the economy, either full time or part time.
It’s easy to define employment: you’re employed if and only if you have a job. Employment is the total number of people currently employed, either full time or part time.
Unemployment, however, is a more subtle concept. Just because a person isn’t working doesn’t mean that we consider that person unemployed. For example, as of October 2014, there were 41.8 million retired workers in the United States receiving Social Security checks. Most of them were probably happy that they were no longer working, so we wouldn’t consider someone who has settled into a comfortable, well-
Unemployment is the number of people who are actively looking for work but aren’t currently employed.
The U.S. Census Bureau, the federal agency tasked with collecting data on unemployment, considers the unemployed to be those who are “jobless, looking for jobs, and available for work.” Retired people don’t count because they aren’t looking for jobs; the disabled don’t count because they aren’t available for work. More specifically, an individual is considered unemployed if he or she doesn’t currently have a job and has been actively seeking a job during the past four weeks. So unemployment is defined as the total number of people who are actively looking for work but aren’t currently employed.
A country’s labor force is the sum of employment and unemployment—
The labor force is equal to the sum of employment and unemployment.

The labor force participation rate is the percentage of the population aged 16 or older that is in the labor force.
The unemployment rate, defined as the percentage of the total number of people in the labor force who are unemployed, is calculated as follows:
The unemployment rate is the percentage of the total number of people in the labor force who are unemployed.

To estimate the numbers that go into calculating the unemployment rate, the U.S. Census Bureau carries out a monthly survey called the Current Population Survey, which involves interviewing a random sample of 60,000 American families. People are asked whether they are currently employed. If they are not employed, they are asked whether they have been looking for a job during the past four weeks. The results are then scaled up, using estimates of the total population, to estimate the total number of employed and unemployed Americans.
The Significance of the Unemployment Rate
In general, the unemployment rate is a good indicator of how easy or difficult it is to find a job given the current state of the economy. When the unemployment rate is low, nearly everyone who wants a job can find one. In 2000, when the unemployment rate averaged just 4%, jobs were so abundant that employers spoke of a “mirror test” for getting a job: if you were breathing (therefore your breath would fog a mirror), you could find work. By contrast, in 2010, with the unemployment rate above 9% all year, it was very hard to find work. In fact, there were almost five times as many Americans seeking work as there were job openings.
Although the unemployment rate is a good indicator of current labor market conditions, it’s not a literal measure of the percentage of people who want a job but can’t find one. That’s because in some ways the unemployment rate exaggerates the difficulty people have in finding jobs. But in other ways, the opposite is true—
How the Unemployment Rate Can Overstate the True Level of Unemployment If you are searching for work, it’s normal to take at least a few weeks to find a suitable job. Yet a worker who is quite confident of finding a job, but has not yet accepted a position, is counted as unemployed. As a consequence, the unemployment rate never falls to zero, even in boom times when jobs are plentiful. Even in the buoyant labor market of 2000, when it was easy to find work, the unemployment rate was still 4%. Later in this chapter, we’ll discuss in greater depth the reasons that measured unemployment persists even when jobs are abundant.
Discouraged workers are nonworking people who are capable of working but have given up looking for a job given the state of the job market.
How the Unemployment Rate Can Understate the True Level of Unemployment Frequently, people who would like to work but aren’t working still don’t get counted as unemployed. In particular, an individual who has given up looking for a job for the time being because there are no jobs available—
Marginally attached workers would like to be employed and have looked for a job in the recent past but are not currently looking for work.
Discouraged workers are part of a larger group—
Underemployment is the number of people who work part time because they cannot find full-
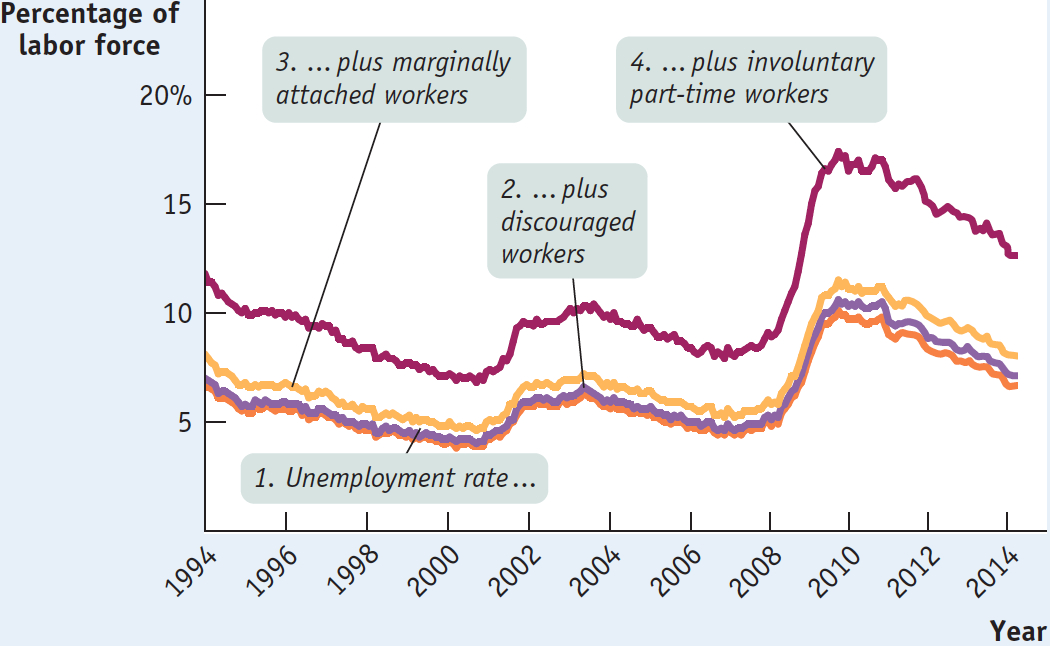
The Bureau of Labor Statistics is the federal agency that calculates the official unemployment rate. It also calculates broader “measures of labor underutilization” that include the three categories of frustrated workers. Figure 8-2 shows what happens to the measured unemployment rate once discouraged workers, other marginally attached workers, and the underemployed are counted. The broadest measure of unemployment and underemployment, known as U-
8-2
Alternative Measures of Unemployment, 1994–
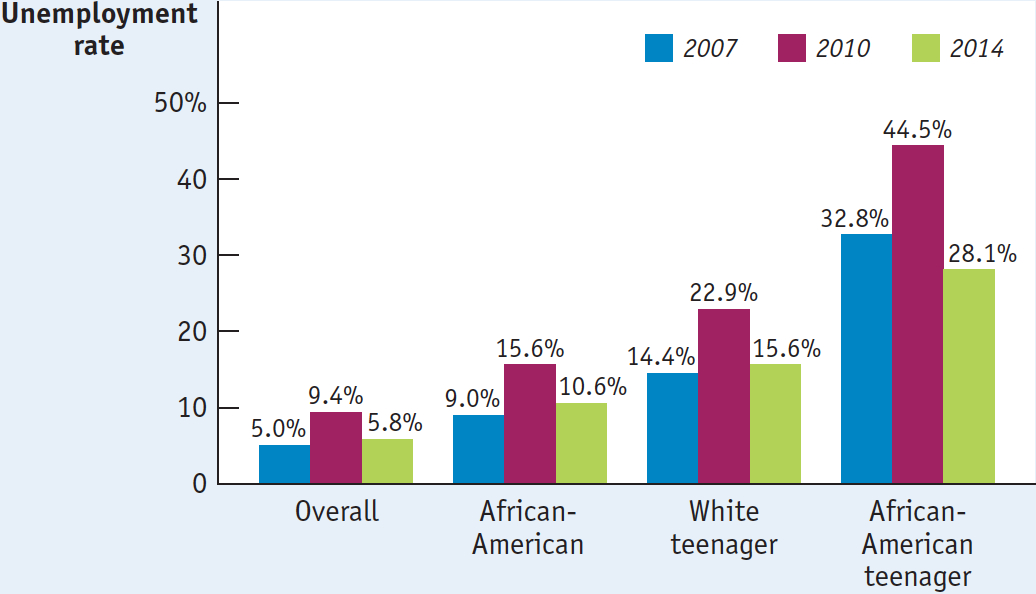
Finally, it’s important to realize that the unemployment rate varies greatly among demographic groups. Other things equal, jobs are generally easier to find for more experienced workers and for workers during their “prime” working years, from ages 25 to 54. For younger workers, as well as workers nearing retirement age, jobs are typically harder to find, other things equal.
Figure 8-3 shows unemployment rates for different groups in 2007, when the overall unemployment rate was low by historical standards, in 2010, when the rate was high in the aftermath of the Great Recession, and in 2014, when it had come down much of, but not all, the way to pre-
8-3
Unemployment Rates of Different Groups in 2007, 2010, and 2014
So you should interpret the unemployment rate as an indicator of overall labor market conditions, not as an exact, literal measure of the percentage of people unable to find jobs. The unemployment rate is, however, a very good indicator: its ups and downs closely reflect economic changes that have a significant impact on people’s lives. Let’s turn now to the causes of these fluctuations.
Growth and Unemployment
Compared to Figure 8-1, Figure 8-4 shows the U.S. unemployment rate over a somewhat shorter period, the 35 years from 1979 through late 2014. The shaded bars represent periods of recession. As you can see, during every recession, without exception, the unemployment rate rose. The severe recession of 2007–
8-4
Unemployment and Recessions, 1979–
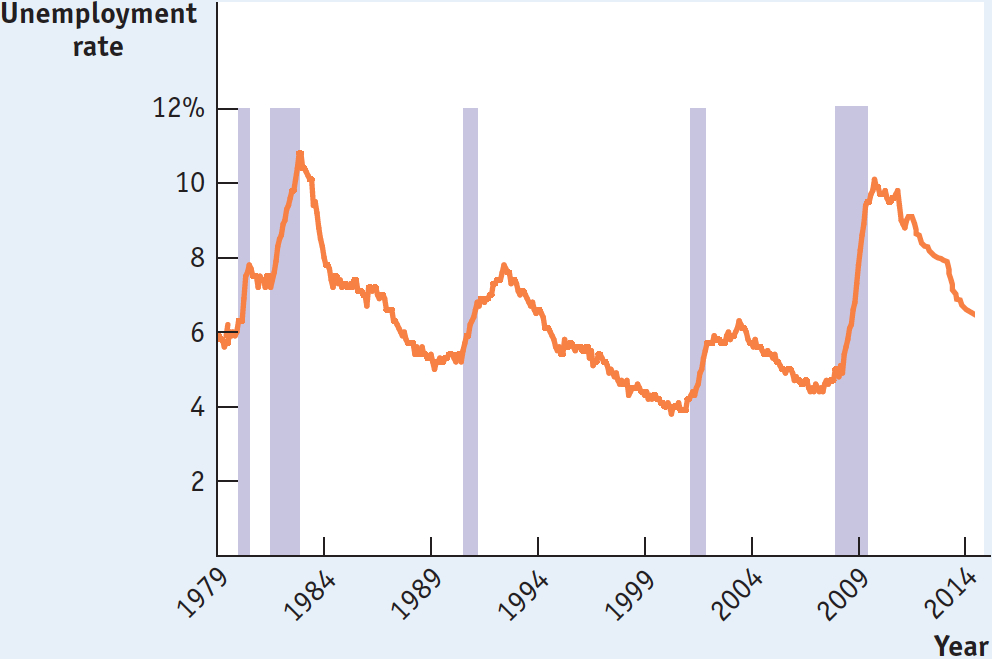
Correspondingly, during periods of economic expansion the unemployment rate usually falls. The long economic expansion of the 1990s eventually brought the unemployment rate to 4.0%, and the expansion of the mid-
Figure 8-5 is a scatter diagram showing U.S. data for the period from 1949 to 2013. The horizontal axis measures the annual rate of growth in real GDP—
8-5
Growth and Changes in Unemployment, 1949–
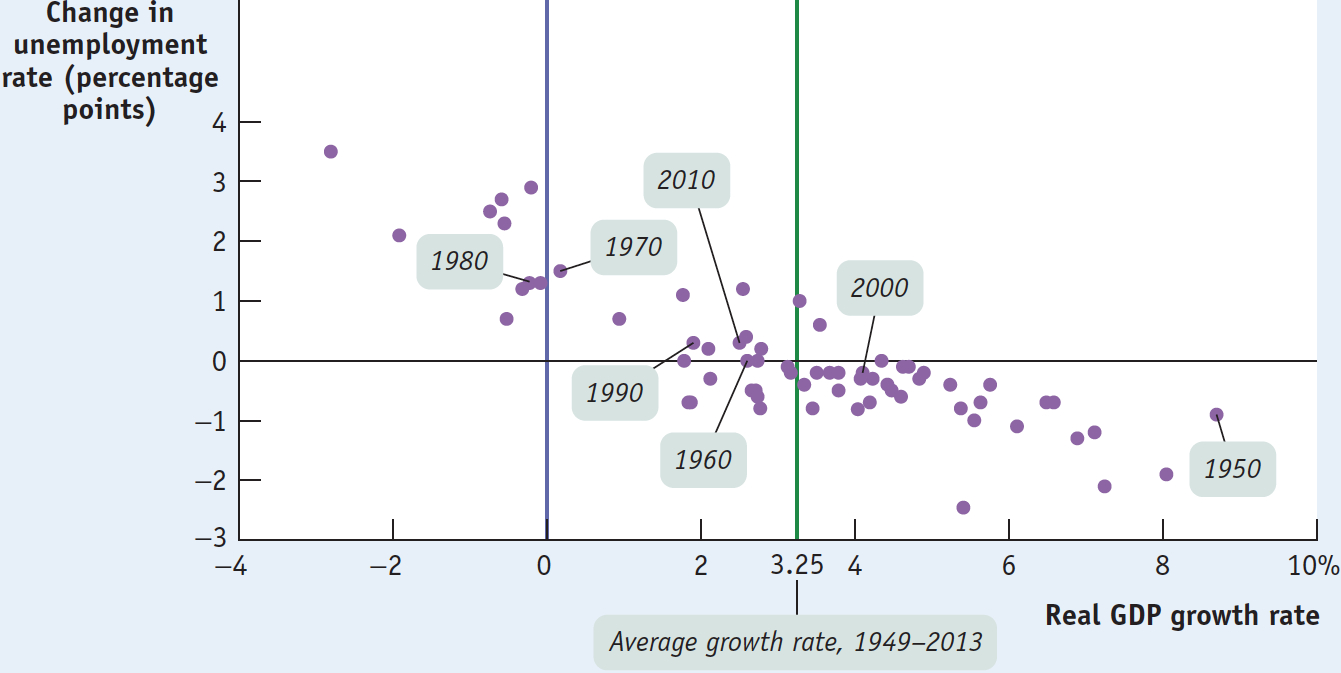
The downward trend of the scatter diagram in Figure 8-5 shows that there is a generally strong negative relationship between growth in the economy and the rate of unemployment. Years of high growth in real GDP were also years in which the unemployment rate fell, and years of low or negative growth in real GDP were years in which the unemployment rate rose.
The green vertical line in Figure 8-5 at the value of 3.25% indicates the average growth rate of real GDP over the period from 1949 to 2013. Points lying to the right of the vertical line are years of above-
A jobless recovery is a period in which the real GDP growth rate is positive but the unemployment rate is still rising.
A period in which real GDP is growing at a below-
ECONOMICS in Action: Failure to Launch
Failure to Launch
In March 2010, when the U.S. job situation was near its worst, the Harvard Law Record published a brief note titled “Unemployed law student will work for $160K plus benefits.” In a self-
8-6
Unemployment Rate for Recent College Graduates, 2007–
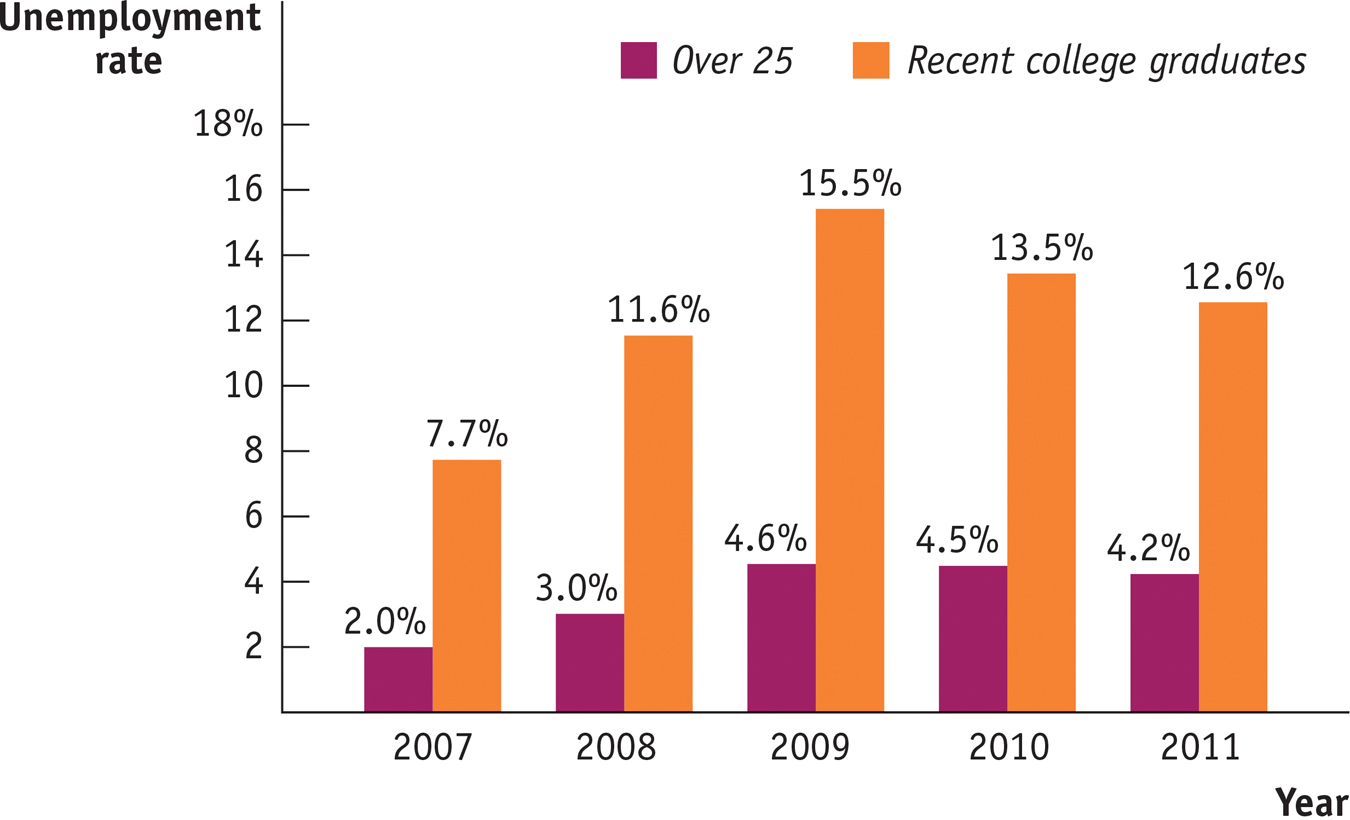
The answer, of course, is that it wasn’t about the résumé—it was about the economy. Times of high unemployment are especially hard on new graduates, who often find it hard to get any kind of full-
How bad was it around the time that note was written? Figure 8-6 shows unemployment rates for two kinds of college graduates—
Quick Review
The labor force, equal to employment plus unemployment, does not include discouraged workers. Nor do labor statistics contain data on underemployment. The labor force participation rate is the percentage of the population age 16 and over in the labor force.
The unemployment rate is an indicator of the state of the labor market, not an exact measure of the percentage of workers who can’t find jobs. It can overstate the true level of unemployment because workers often spend time searching for a job even when jobs are plentiful. But it can also understate the true level of unemployment because it excludes discouraged workers, marginally attached workers, and underemployed workers.
There is a strong negative relationship between growth in real GDP and changes in the unemployment rate. When growth is above average, the unemployment rate generally falls. When growth is below average, the unemployment rate generally rises—
a period called a jobless recovery that typically follows a deep recession.
8-1
Question 8.1
Suppose that the advent of employment websites enables job-
seekers to find suitable jobs more quickly. What effect will this have on the unemployment rate over time? Also suppose that these websites encourage job- seekers who had given up their searches to begin looking again. What effect will this have on the unemployment rate? The advent of websites that enable job-seekers to find jobs more quickly will reduce the unemployment rate over time. However, websites that induce discouraged workers to begin actively looking for work again will lead to an increase in the unemployment rate over time.
Question 8.2
In which of the following cases is a worker counted as unemployed? Explain.
Rosa, an older worker who has been laid off and who gave up looking for work months ago
Rosa is not counted as unemployed because she is not actively looking for work, but she is counted in broader measures of labor underutilization as a discouraged worker.
Anthony, a schoolteacher who is not working during his three-
month summer break Anthony is not counted as unemployed; he is considered employed because he has a job.
Grace, an investment banker who has been laid off and is currently searching for another position
Grace is unemployed; she is not working and is actively looking for work.
Sergio, a classically trained musician who can only find work playing for local parties
Sergio is not unemployed, but underemployed; he is working part time for economic reasons. He is counted in broader measures of labor underutilization.
Natasha, a graduate student who went back to school because jobs were scarce
Natasha is not unemployed, but she is a marginally attached worker. She is counted in broader measures of labor underutilization.
Question 8.3
Which of the following are consistent with the observed relationship between growth in real GDP and changes in the unemployment rate as shown in Figure 8-5? Which are not?
A rise in the unemployment rate accompanies a fall in real GDP.
An exceptionally strong business recovery is associated with a greater percentage of the labor force being employed.
Negative real GDP growth is associated with a fall in the unemployment rate.
Both parts a and b are consistent with the relationship, illustrated in Figure 8-5, between above-average or below-average growth in real GDP and changes in the unemployment rate: during years of above-average growth, the unemployment rate falls, and during years of below-average growth, the unemployment rate rises. However, part c is not consistent: it implies that a recession is associated with a fall in the unemployment rate, which is correct.
Solutions appear at back of book.