10A-8
Differences in Preferences
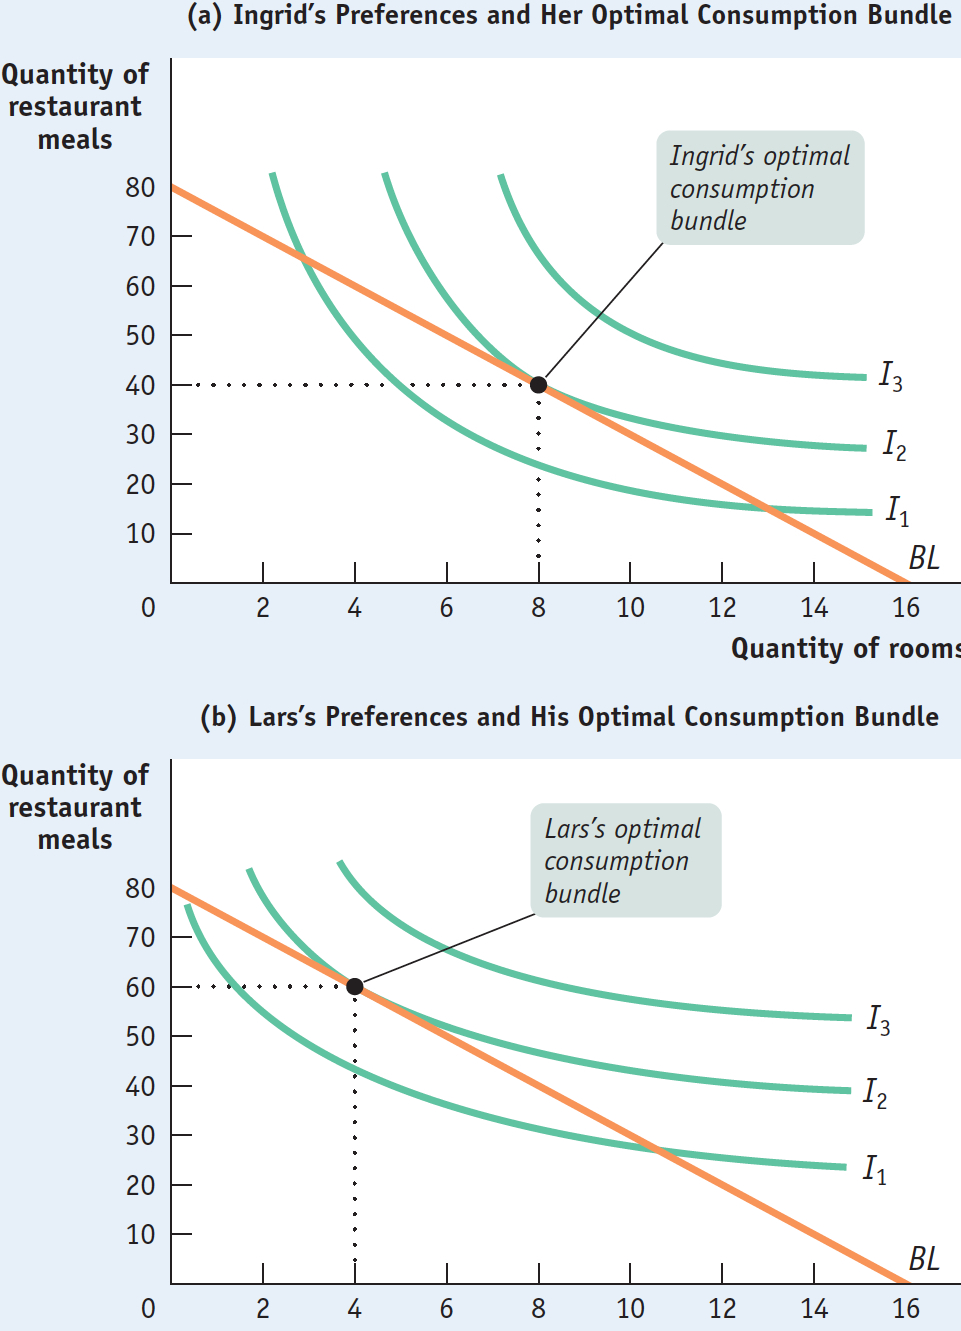
Differences in Preferences Ingrid and Lars have different preferences, reflected in the different shapes of their indifference curve maps. So they will choose different consumption bundles even when they have the same possible choices. Both of them have an income of $2,400 per month and face prices of $30 per meal and $150 per room. Panel (a) shows Ingrid’s consumption choice: 8 rooms and 40 restaurant meals. Panel (b) shows Lars’s choice: even though he has the same budget line, he consumes fewer rooms and more restaurant meals.