Supply and Demand
3
 What You Will Learn in This Chapter
What a competitive market is and how it is described by the supply and demand model
What the demand curve and the supply curve are
The difference between movements along a curve and shifts of a curve
How the supply and demand curves determine a market’s equilibrium price and equilibrium quantity
In the case of a shortage or surplus, how price moves the market back to equilibrium
A NATURAL GAS BOOM
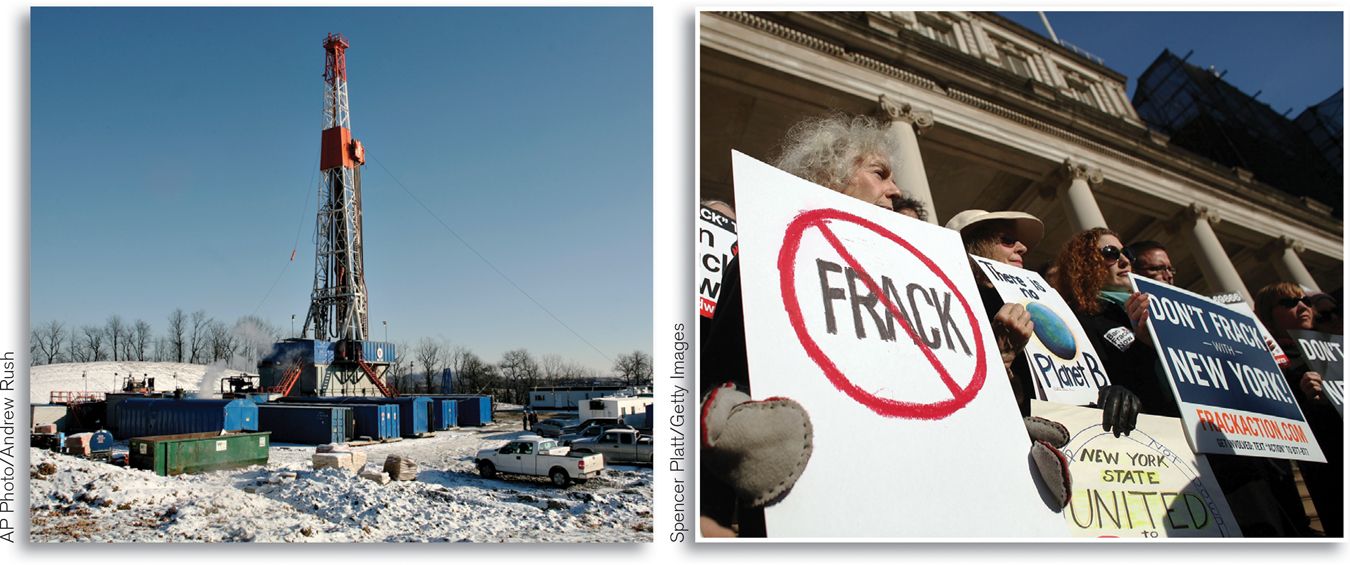
Spencer Platt/Getty Images
PRESIDENT OBAMA GOT A VIVID illustration of American free speech in action while touring upstate New York on August 23, 2013. The president was greeted by more than 500 chanting and sign-
Until recently, that is. A few decades ago, new drilling technologies were developed that made it possible to reach these deeply embedded deposits. But what finally pushed energy companies to invest in and adopt these new extraction technologies was the high price of natural gas over the last decade. What accounted for these high natural gas prices—
First, the demand side. In 2002, the U.S. economy was mired in recession; with economic activity low and job losses high, people and businesses cut back their energy consumption. For example, to save money, homeowners turned down their thermostats in winter and turned them up in the summer. But by 2006, the U.S. economy came roaring back, and natural gas consumption rose. Second, the supply side. In 2005, Hurricane Katrina devastated the American Gulf Coast, site of most of the country’s natural gas production at the time. So by 2006 the demand for natural gas had surged while the supply of natural gas had been severely curtailed. As a result, in 2006 natural gas prices peaked at around $14 per thousand cubic feet, up from around $2 in 2002.
Fast-
The benefits of much lower natural gas prices have not only led to lower heating costs for American consumers, they have also cascaded through American industries, particularly power generation and transportation. Electricity-
Yet the benefits of natural gas have been accompanied by deep reservations and controversy over the environmental effects of fracking. While there are clear environmental benefits from the shift by consumers and industries to natural gas (which burns cleaner than the other, heavily polluting fossil fuels, gasoline and coal), fracking has sparked another set of environmental worries. One is the potential for contamination of local groundwater by chemicals used in fracking. Another is that cheap natural gas may discourage the adoption of more expensive renewable energy sources like solar and wind power, furthering our dependence upon fossil fuel.
So it was the face-
But for this chapter we will stick to the topic of supply and demand. How, exactly, does the high price of natural gas nearly a decade ago translate into today’s switch to vehicles powered by natural gas? The short answer is that it’s a matter of supply and demand. But what does that mean? Many people use “supply and demand” as a sort of catchphrase to mean “the laws of the marketplace at work.” To economists, however, the concept of supply and demand has a precise meaning: it is a model of how a market behaves that is extremely useful for understanding many—
In this chapter, we lay out the pieces that make up the supply and demand model, put them together, and show how this model can be used.