Supply, Demand, and Equilibrium
We have now covered the first three key elements in the supply and demand model: the demand curve, the supply curve, and the set of factors that shift each curve. The next step is to put these elements together to show how they can be used to predict the actual price at which the good is bought and sold, as well as the actual quantity transacted.
A competitive market is in equilibrium when price has moved to a level at which the quantity of a good or service demanded equals the quantity of that good or service supplied. The price at which this takes place is the equilibrium price, also referred to as the market-
What determines the price at which a good or service is bought and sold? What determines the quantity transacted of the good or service? In Chapter 1 we learned the general principle that markets move toward equilibrium, a situation in which no individual would be better off taking a different action. In the case of a competitive market, we can be more specific: a competitive market is in equilibrium when the price has moved to a level at which the quantity of a good demanded equals the quantity of that good supplied. At that price, no individual seller could make herself better off by offering to sell either more or less of the good and no individual buyer could make himself better off by offering to buy more or less of the good. In other words, at the market equilibrium, price has moved to a level that exactly matches the quantity demanded by consumers to the quantity supplied by sellers.
The price that matches the quantity supplied and the quantity demanded is the equilibrium price; the quantity bought and sold at that price is the equilibrium quantity. The equilibrium price is also known as the market-
Finding the Equilibrium Price and Quantity
The easiest way to determine the equilibrium price and quantity in a market is by putting the supply curve and the demand curve on the same diagram. Since the supply curve shows the quantity supplied at any given price and the demand curve shows the quantity demanded at any given price, the price at which the two curves cross is the equilibrium price: the price at which quantity supplied equals quantity demanded.
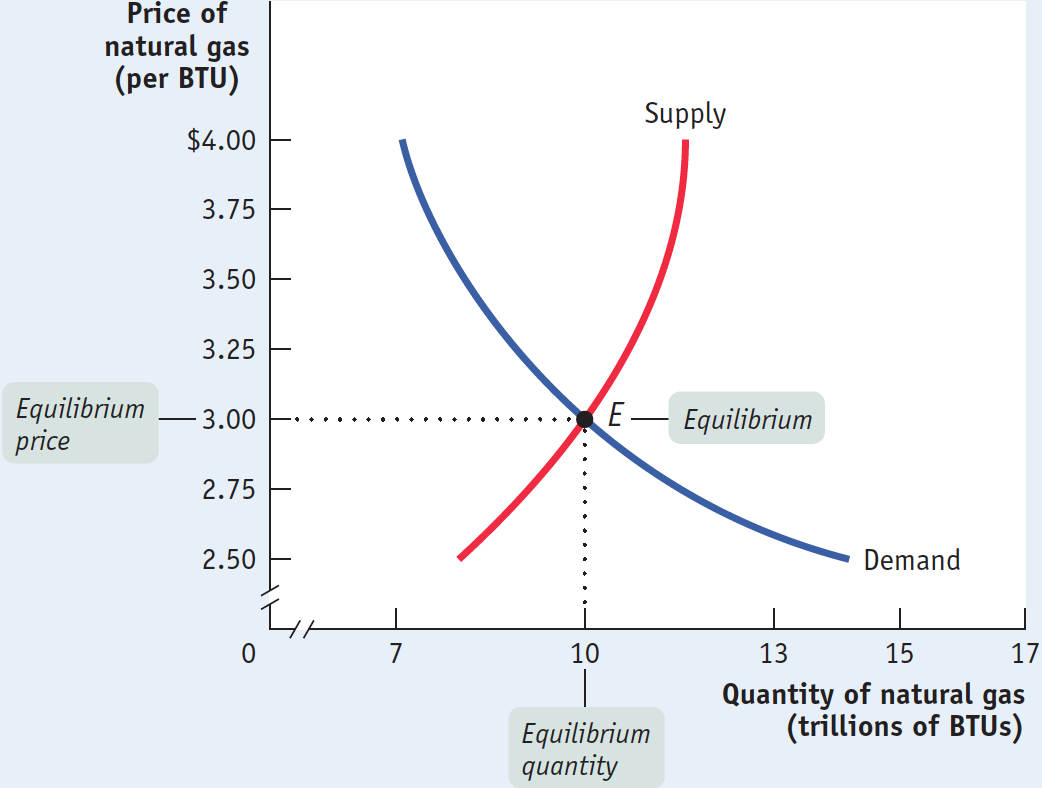
Figure 3-11 combines the demand curve from Figure 3-1 and the supply curve from Figure 3-6. They intersect at point E, which is the equilibrium of this market; $3 is the equilibrium price and 10 trillion BTUs is the equilibrium quantity.
3-11
Market Equilibrium
PITFALLS: BOUGHT AND SOLD?
BOUGHT AND SOLD?
We have been talking about the price at which a good or service is bought and sold, as if the two were the same. But shouldn’t we make a distinction between the price received by sellers and the price paid by buyers? In principle, yes; but it is helpful at this point to sacrifice a bit of realism in the interest of simplicity—
In reality, there is often a middleman—
In many markets, however, the difference between the buying and selling price is quite small. So it’s not a bad approximation to think of the price paid by buyers as being the same as the price received by sellers. And that is what we assume in this chapter.
Let’s confirm that point E fits our definition of equilibrium. At a price of $3 per BTU, natural gas producers are willing to sell 10 trillion BTUs a year and natural gas consumers want to buy 10 trillion BTUs a year. So at the price of $3 per BTU, the quantity of natural gas supplied equals the quantity demanded. Notice that at any other price the market would not clear: every willing buyer would not be able to find a willing seller, or vice versa. More specifically, if the price were more than $3, the quantity supplied would exceed the quantity demanded; if the price were less than $3, the quantity demanded would exceed the quantity supplied.
The model of supply and demand, then, predicts that given the demand and supply curves shown in Figure 3-11, 10 trillion BTUs would change hands at a price of $3 per BTU. But how can we be sure that the market will arrive at the equilibrium price? We begin by answering three simple questions:
Why do all sales and purchases in a market take place at the same price?
Why does the market price fall if it is above the equilibrium price?
Why does the market price rise if it is below the equilibrium price?
Why Do All Sales and Purchases in a Market Take Place at the Same Price?
There are some markets where the same good can sell for many different prices, depending on who is selling or who is buying. For example, have you ever bought a souvenir in a “tourist trap” and then seen the same item on sale somewhere else (perhaps even in the shop next door) for a lower price? Because tourists don’t know which shops offer the best deals and don’t have time for comparison shopping, sellers in tourist areas can charge different prices for the same good.
But in any market where the buyers and sellers have both been around for some time, sales and purchases tend to converge at a generally uniform price, so we can safely talk about the market price. It’s easy to see why. Suppose a seller offered a potential buyer a price noticeably above what the buyer knew other people to be paying. The buyer would clearly be better off shopping elsewhere—
Conversely, a seller would not be willing to sell for significantly less than the amount he knew most buyers were paying; he would be better off waiting to get a more reasonable customer. So in any well-
Why Does the Market Price Fall If It Is Above the Equilibrium Price?
Suppose the supply and demand curves are as shown in Figure 3-11 but the market price is above the equilibrium level of $3—
3-12
Price Above Its Equilibrium Level Creates a Surplus
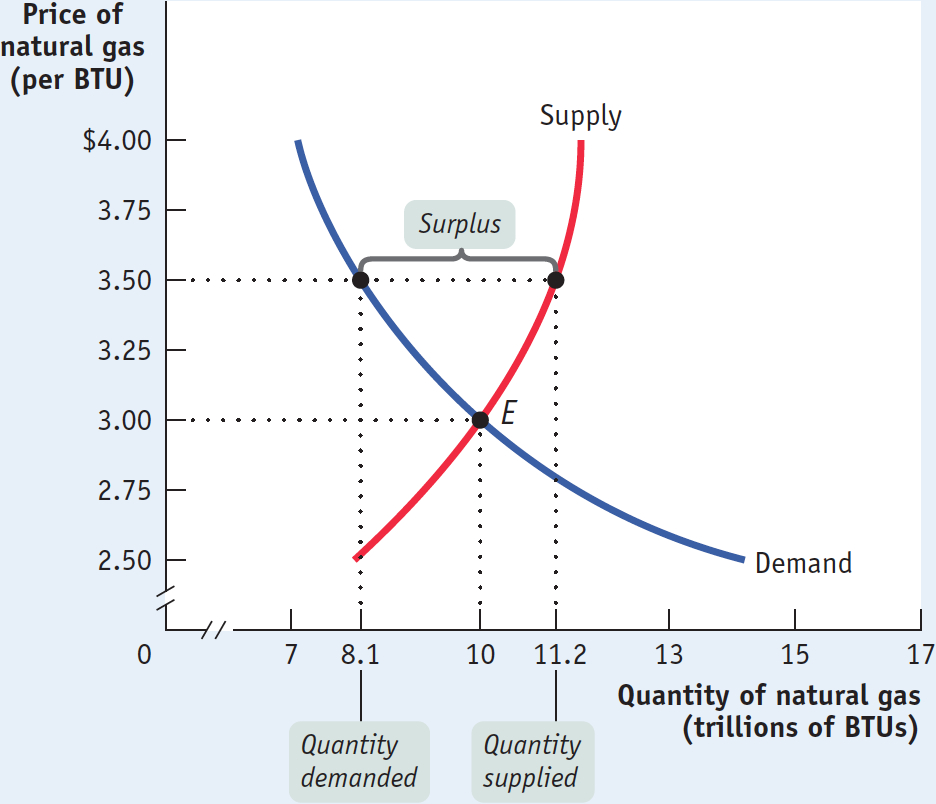
There is a surplus of a good or service when the quantity supplied exceeds the quantity demanded. Surpluses occur when the price is above its equilibrium level.
As the figure shows, at a price of $3.50 there would be more BTUs of natural gas available than consumers wanted to buy: 11.2 trillion BTUs versus 8.1 trillion BTUs. The difference of 3.1 trillion BTUs is the surplus—also known as the excess supply—of natural gas at $3.50.
This surplus means that some natural gas producers are frustrated: at the current price, they cannot find consumers who want to buy their natural gas. The surplus offers an incentive for those frustrated would-
Why Does the Market Price Rise If It Is Below the Equilibrium Price?
There is a shortage of a good or service when the quantity demanded exceeds the quantity supplied. Shortages occur when the price is below its equilibrium level.
Now suppose the price is below its equilibrium level—
3-13
Price Below Its Equilibrium Level Creates a Shortage
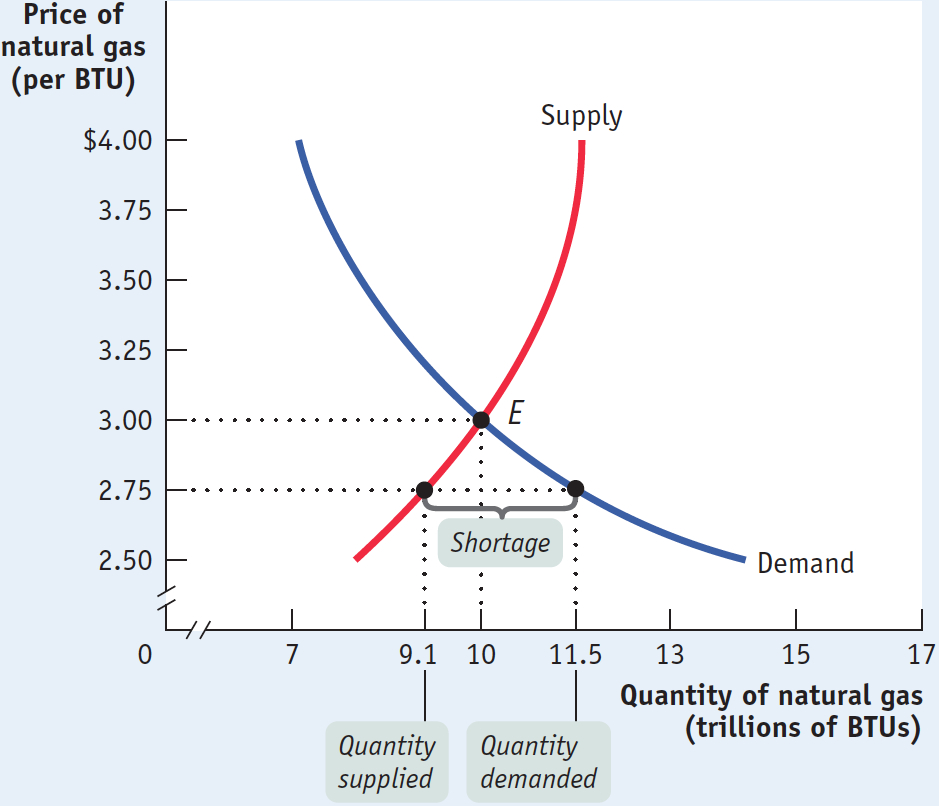
When there is a shortage, there are frustrated would-
Using Equilibrium to Describe Markets
We have now seen that a market tends to have a single price, the equilibrium price. If the market price is above the equilibrium level, the ensuing surplus leads buyers and sellers to take actions that lower the price. And if the market price is below the equilibrium level, the ensuing shortage leads buyers and sellers to take actions that raise the price. So the market price always moves toward the equilibrium price, the price at which there is neither surplus nor shortage.
!worldview! ECONOMICS in Action: The Price of Admission
The Price of Admission
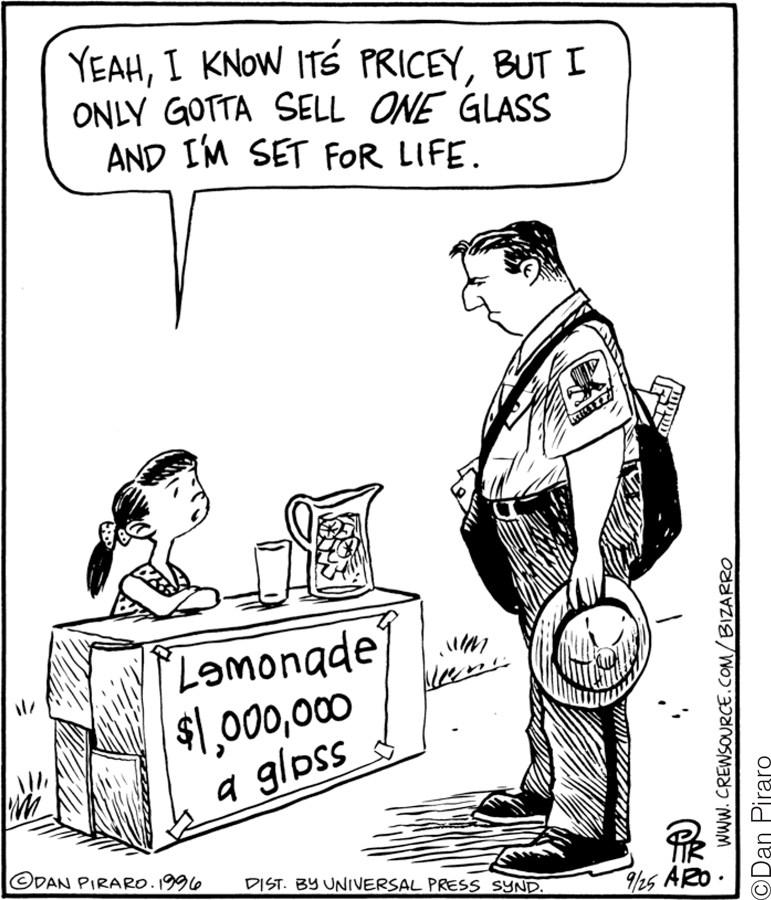
The market equilibrium, so the theory goes, is pretty egalitarian because the equilibrium price applies to everyone. That is, all buyers pay the same price—
The market for concert tickets is an example that seems to contradict the theory—
Puzzling as this may seem, there is no contradiction once we take opportunity costs and tastes into account. For major events, buying tickets from the box office means waiting in very long lines. Ticket buyers who use online resellers have decided that the opportunity cost of their time is too high to spend waiting in line. And tickets for major events being sold at face value by online box offices often sell out within minutes. In this case, some people who want to go to the concert badly but have missed out on the opportunity to buy cheaper tickets from the online box office are willing to pay the higher online reseller price.
Not only that—
According to an article in the New York Times, tickets on StubHub.com can sell for less than the face value for events with little appeal, but prices can skyrocket for events that are in high demand. (The article quotes a price of $3,530 for a Madonna concert.) Even StubHub.com’s chief executive says his site is “the embodiment of supply-
So the theory of competitive markets isn’t just speculation. If you want to experience it for yourself, try buying tickets to a concert.
Quick Review
Price in a competitive market moves to the equilibrium price, or market-
clearing price , where the quantity supplied is equal to the quantity demanded. This quantity is the equilibrium quantity.All sales and purchases in a market take place at the same price. If the price is above its equilibrium level, there is a surplus that drives the price down to the equilibrium level. If the price is below its equilibrium level, there is a shortage that drives the price up to the equilibrium level.
3-3
Question 3.3
In the following three situations, the market is initially in equilibrium. Explain the changes in either supply or demand that result from each event. After each event described below, does a surplus or shortage exist at the original equilibrium price? What will happen to the equilibrium price as a result?
2013 was a very good year for California wine-
grape growers, who produced a bumper crop. The supply curve shifts rightward. At the original equilibrium price of the year before, the quantity of grapes supplied exceeds the quantity demanded. This is a case of surplus. The price of grapes will fall.After a hurricane, Florida hoteliers often find that many people cancel their upcoming vacations, leaving them with empty hotel rooms.
The demand curve shifts leftward. At the original equilibrium price, the quantity of hotel rooms supplied exceeds the quantity demanded. This is a case of surplus. The rates for hotel rooms will fall.After a heavy snowfall, many people want to buy second-
hand snowblowers at the local tool shop. The demand curve for second-hand snowblowers shifts rightward. At the original equilibrium price, the quantity of second-hand snowblowers demanded exceeds the quantity supplied. This is a case of shortage. The equilibrium price of second-hand snowblowers will rise.
Solutions appear at back of book.