1.1 45Introduction to Macroeconomics
WHAT YOU WILL LEARN
 What a business cycle is and why diminishing the severity of business cycles is a goal for policy makers
 How long-
run economic growth determines a country’s standard of living  The meaning of inflation and deflation and why price stability is preferred
 The importance of open-
economy macroeconomics and how economies interact through trade deficits and trade surpluses
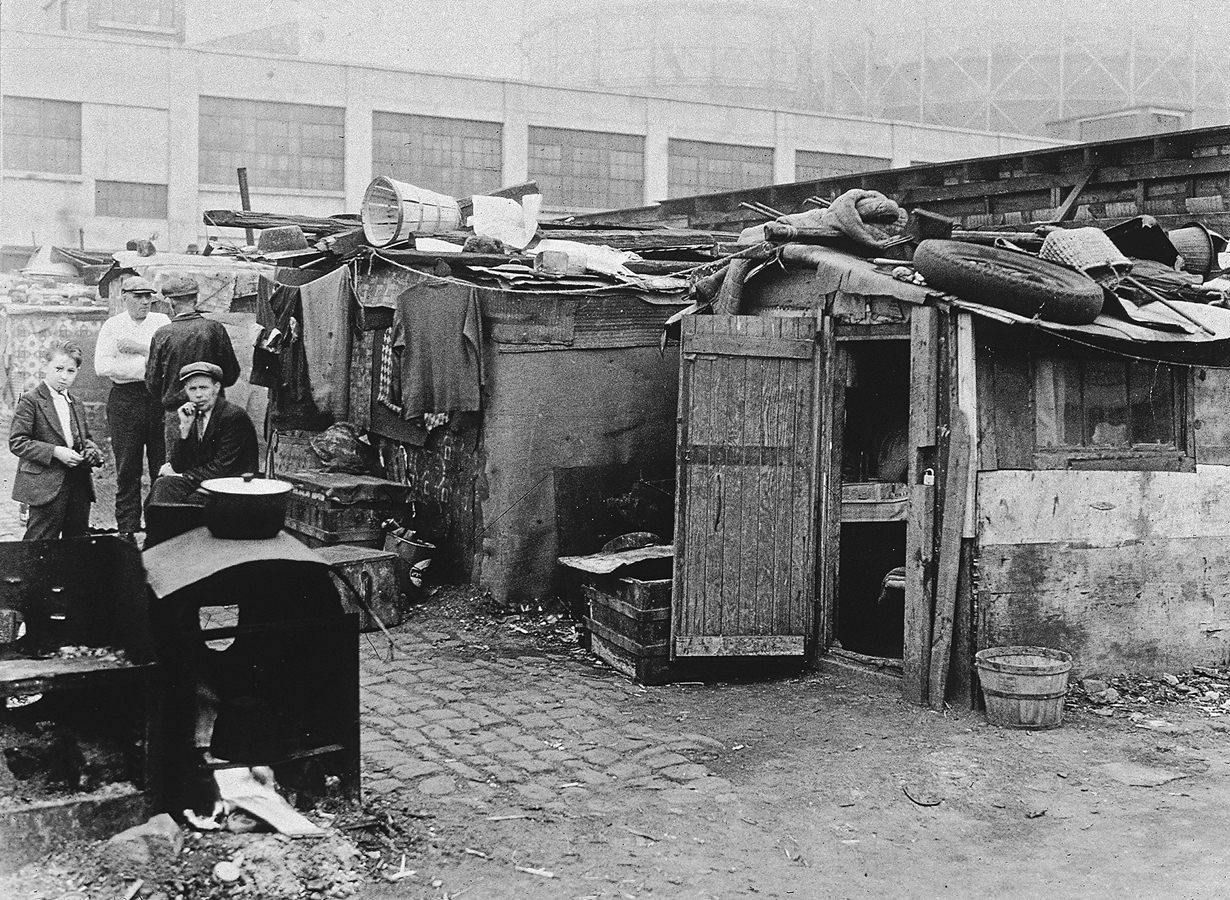
Today many people enjoy walking through New York’s beautiful Central Park. But in 1932 there were many people living there in squalor in one of the many “Hoovervilles”—the shantytowns that had sprung up across America as a result of a catastrophic economic slump that started in 1929. Millions of people were out of work and unable to feed, clothe, and house themselves and their families. Beginning in 1933, the U.S. economy would stage a partial recovery. But joblessness stayed high throughout the 1930s—
These shantytowns were named after Herbert Hoover, who had been elected president in 1928. When the Depression struck, people blamed Hoover who, along with his economic advisers, didn’t seem to understand the crisis and had no idea what to do about it.
At the time of the Great Depression, microeconomics, which is concerned with the consumption and production decisions of individual consumers and producers and with the allocation of scarce resources among industries, was already a well-
But macroeconomics came into its own during the Depression. Economists realized that they needed to understand the nature of the catastrophe that had overtaken the United States and much of the rest of the world in order to learn how to avoid such events in the future. To this day, the effort to understand economic slumps and find ways to prevent them is at the core of macroeconomics.
In this module we will begin to explore the key features of macroeconomic analysis. We will look at some of the field’s major concerns, including
- Business cycles
- Economic growth
- Price stability
- Trade imbalances
The Business Cycle
Figure 45-1 shows a stylized representation of the way the economy evolves over time. The vertical axis shows either employment or an indicator of how much the economy is producing, such as real gross domestic product (real GDP), a measure of the economy’s overall output that we’ll learn about in the next module

Recessions, or contractions, are periods of economic downturn when output and employment are falling.
Expansions, or recoveries, are periods of economic upturn when output and employment are rising.
The business cycle is the short-
The point at which the economy turns from expansion to recession is a business-
The point at which the economy turns from recession to expansion is a business-
A broad-
The business cycle is an enduring feature of the economy. Table 45-1 shows the official list of business-
45-1
The History of the Business Cycle

The Pain of Recession
Not many people complain about the business cycle when the economy is expanding. Recessions, however, create a great deal of pain.
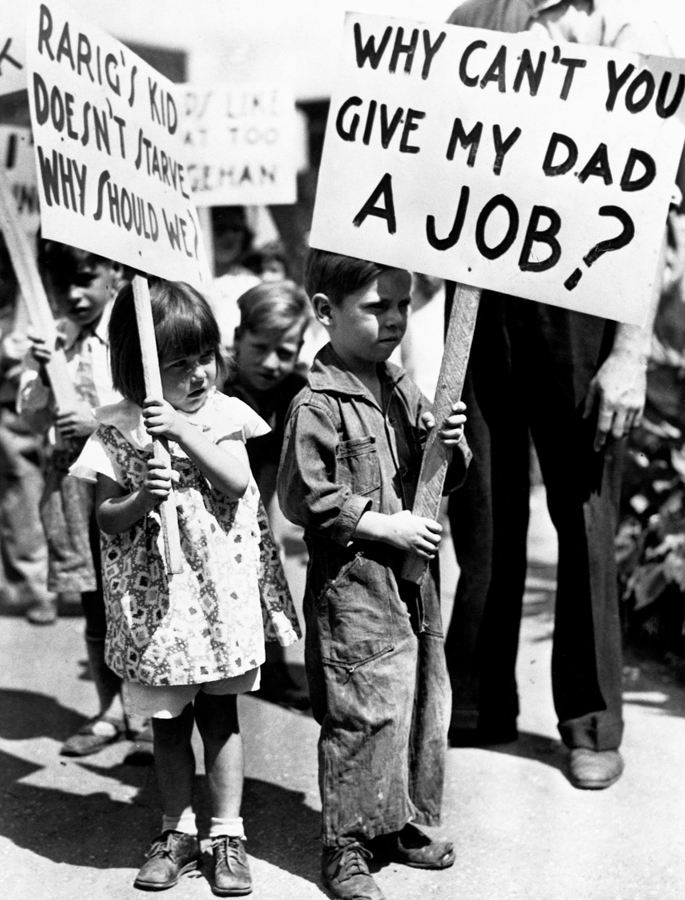
The most important effect of a recession is its impact on the ability of workers to find and hold jobs. The most widely used indicator of conditions in the labor market is the unemployment rate. We’ll explain how that rate is calculated in the next section, but for now it’s enough to say that a high unemployment rate tells us that jobs are scarce and a low unemployment rate tells us that jobs are easy to find. Figure 45-2 shows the unemployment rate from 1988 to 2013. As you can see, the U.S. unemployment rate surged during and after each recession but eventually fell during periods of expansion. The rising unemployment rate in 2008 was a sign that a new recession might be under way, which was later confirmed by the NBER to have begun in December 2007.

Because recessions cause many people to lose their jobs and also make it hard to find new ones, recessions hurt the standard of living of many families. Recessions are usually associated with a rise in the number of people living below the poverty line, an increase in the number of people who lose their houses because they can’t afford the mortgage payments, and a fall in the percentage of Americans with health insurance coverage.
You should not think, however, that workers are the only group that suffers during a recession. Recessions are also bad for firms: like employment and wages, profits suffer during recessions, with many small businesses failing.
All in all, then, recessions are bad for almost everyone. Can anything be done to reduce their frequency and severity?
DEFINING RECESSIONS AND EXPANSIONS
How exactly are recessions and expansions defined? The answer is that there is no exact definition!
In many countries, economists adopt the rule that a recession is a period of at least two consecutive quarters (a quarter is three months) during which the total output of the economy shrinks. The two-
Sometimes, however, this definition seems too strict. For example, an economy that has three months of sharply declining output, then three months of slightly positive growth, then another three months of rapid decline, should surely be considered to have endured a nine-
In the United States, we try to avoid such misclassifications by assigning the task of determining when a recession begins and ends to an independent panel of experts at the National Bureau of Economic Research (NBER). This panel looks at a variety of economic indicators, with the main focus on employment and production, and then makes a judgment call.
Sometimes this judgment is controversial. In fact, there is lingering controversy over the 2001 recession. According to the NBER, that recession began in March 2001 and ended in November 2001 when output began rising. Some critics argue, however, that the recession really began several months earlier, when industrial production began falling. Other critics argue that the recession didn’t really end in 2001 because employment continued to fall and the job market remained weak for another year and a half.
Taming the Business Cycle
Modern macroeconomics largely came into being as a response to the worst recession in history—
The work of the British economist John Maynard Keynes, published during the Great Depression, suggested that a depressed economy results from inadequate spending, and that using monetary policy (changing the quantity of money to alter interest rates, which in turn affect overall spending) and fiscal policy (changing taxes and government spending to affect overall spending) can mitigate the effect of recessions. To this day, governments turn to these policies, known as Keynesian Economics, when recession strikes. Later work, notably that of another great macroeconomist, Milton Friedman, led to a consensus that it’s important to rein in booms as well as to fight slumps.
So modern policy makers try to “smooth out” the business cycle. They haven’t been completely successful, as a look at Table 45-1 makes clear. It’s widely believed, however, that policy guided by macroeconomic analysis has helped make the economy more stable.
Although the business cycle is one of the main concerns of macroeconomics and historically played a crucial role in fostering the development of the field, macroeconomists are also concerned with other issues, such as the question of long-
COMPARING RECESSIONS
The alternation of recessions and expansions seems to be an enduring feature of economic life. However, not all business cycles are created equal. In particular, some recessions have been much worse than others.
Let’s compare the two most recent recessions: the 2001 recession and the Great Recession of 2007–
In Figure 45-3 we compare the depth of the recessions by looking at what happened to industrial production over the months after the recession began. In each case, production is measured as a percentage of its level at the recession’s start. Thus the line for the 2007–

Clearly, the 2007–
Of course, this was no consolation to the millions of American workers who lost their jobs, even in that mild recession.
Long-Run Economic Growth
In 1955, Americans were delighted with the nation’s prosperity. The economy was expanding, consumer goods that had been rationed during World War II were available for everyone to buy, and most Americans believed, rightly, that they were better off than the citizens of any other nation, past or present.
Yet by today’s standards, Americans were quite poor in 1955. Figure 45-4 shows the percentage of American homes equipped with a variety of appliances in 1905, 1955, and 2005: in 1955 only 37% of American homes contained washing machines and hardly anyone had air conditioning. And if we turn the clock back another half-

Long-
Why are the vast majority of Americans today able to afford conveniences that many Americans lacked in 1955? The answer is long-

Part of the long-
Long-
When growth slows, as it did in the 1970s, it can help feed a national mood of pessimism. In particular, long-
Long-
Inflation and Deflation
In January 1980 the average production worker in the United States was paid $6.57 an hour. By December 2013, the average hourly earnings for such a worker had risen to $19.40 an hour. Three cheers for economic progress!
But wait. American workers were paid much more in 2013, but they also faced a much higher cost of living. In early 1980, a dozen eggs cost only about $0.88; by December 2013, that was up to $2.00. The price of a loaf of white bread went from about $0.50 to $1.39. And the price of a gallon of gasoline rose from just $1.11 to $3.33.
Figure 45-6 compares the percentage increase in hourly earnings between 1980 and 2013 with the increases in the prices of some standard items: the average worker’s paycheck went further in terms of some goods, but less far in terms of others. Overall, the rise in the cost of living wiped out many, if not all, of the wage gains of the typical worker from 1980 to 2013. In other words, once changes in prices are taken into account, the living standard of the typical U.S. worker has stagnated from 1980 to the present.

A rising overall level of prices is inflation.
A falling overall level of prices is deflation.
The point is that between 1980 and 2013 the economy experienced substantial inflation: a rise in the overall level of prices. Understanding the causes of inflation and its opposite, deflation—a fall in the overall level of prices—
- Inflation discourages people from holding onto cash, because cash loses value over time if the overall price level is rising. That is, the amount of goods and services you can buy with a given amount of cash falls. In extreme cases, people stop holding cash altogether and turn to barter.
- Deflation can cause the reverse problem. If the price level is falling, cash gains value over time. In other words, the amount of goods and services you can buy with a given amount of cash increases. So holding on to it can become more attractive than investing in new factories and other productive assets. This can deepen a recession.
The economy has price stability when the overall level of prices changes slowly or not at all.
We’ll describe other costs of inflation and deflation in a later section. For now, let’s just note that, in general, economists regard price stability—in which the overall level of prices is changing, if at all, only slowly—
International Imbalances
An open economy is an economy that trades goods and services with other countries.
The United States is an open economy that trades goods and services with other countries. There have been times when that trade was more or less balanced—
A country runs a trade deficit when the value of goods and services bought from foreigners is more than the value of goods and services it sells to them. It runs a trade surplus when the value of goods and services bought from foreigners is less than the value of the goods and services it sells to them.
In 2012, the United States ran a big trade deficit—that is, the value of the goods and services U.S. residents bought from the rest of the world was a lot larger than the value of the goods and services American producers sold to customers abroad.
Meanwhile, some other countries were in the opposite position, selling much more to foreigners than they bought. Figure 45-7 shows the exports and imports of goods and services for several important economies in 2012. As you can see, the United States imported much more than it exported, but Germany, China, and Saudi Arabia did the reverse: they each ran a trade surplus.

A country runs a trade surplus when the value of the goods and services it buys from the rest of the world is smaller than the value of the goods and services it sells abroad. Was America’s trade deficit a sign that something was wrong with our economy—
No, not really. Trade deficits and their opposite, trade surpluses, are macroeconomic phenomena. They’re the result of situations in which the whole is very different from the sum of its parts. You might think that countries with highly productive workers or widely desired products and services to sell run trade surpluses while countries with unproductive workers or poor-
Microeconomic analysis tells us why countries trade but not why they run trade surpluses or deficits. Earlier we learned that international trade is the result of comparative advantage: countries export goods they’re relatively good at producing and import goods they’re not as good at producing. That’s why the United States exports wheat and imports coffee. One important question the concept of comparative advantage doesn’t answer, however, is why the value of a country’s imports is sometimes much larger than the value of its exports, or vice versa.
So what does determine whether a country runs a trade surplus or a trade deficit? Later on we’ll learn the surprising answer: the determinants of the overall balance between exports and imports lie in decisions about savings and investment spending—
45
Solutions appear at the back of the book.
Check Your Understanding
Why do we talk about business cycles for the economy as a whole, rather than just talking about the ups and downs of particular industries?
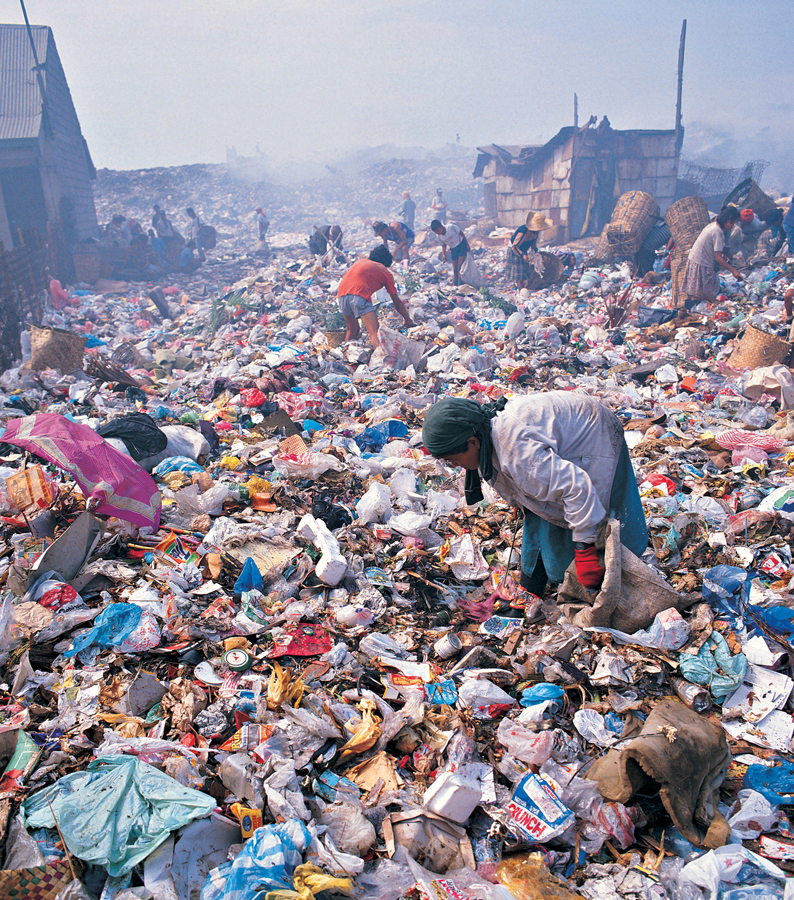
We talk about business cycles for the economy as a whole because recessions and expansions are not confined to a few industries—they reflect downturns and upturns for the economy as a whole. In downturns, almost every sector of the economy reduces output and the number of people employed. Moreover, business cycles are an international phenomenon, sometimes moving in rough synchrony across countries.Many poor countries have high rates of population growth. What does this imply about the long-
run growth rates of overall output that they must achieve in order to generate a higher standard of living per person? Countries with high rates of population growth will have to maintain higher growth rates of overall output than countries with low rates of population growth in order to achieve an increased standard of living per person because aggregate output will have to be divided among a larger number of people.Which of these sound like inflation, which sound like deflation, and which are ambiguous?
-
a. Gasoline prices are up 10%, food prices are down 20%, and the prices of most services are up 1%–2%.
As some prices have risen but other prices have fallen, there may be overall inflation or deflation. The answer is ambiguous. -
b. Gas prices have doubled, food prices are up 50%, and prices of most services seem to be up 5% or 10%.
As all prices have risen significantly, this sounds like inflation. -
c. Gas prices haven’t changed, food prices are way down, and services have gotten cheaper, too.
As most prices have fallen and others have not changed, this sounds like deflation.
-
Multiple-
Question
During the recession phase of a business cycle, which of the following is likely to increase?
A. B. C. D. E. Question
Based on the data below, which of the following is true about the period from 1990–
2009? 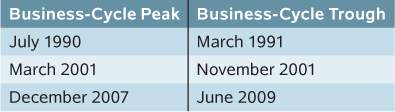
A. B. C. D. E. Question
A sustained increase in aggregate output over several decades represents
A. B. C. D. E. Question
Which of the following is the most likely result of inflation?
A. B. C. D. E. Question
If the value of goods and services bought from other countries is more than the value of goods and services sold to other countries, this is called
A. B. C. D. E.
Critical-
Argentina used to be as rich as Canada; now it’s much poorer. Does this mean that Argentina is poorer than it was in the past? Explain your answer.