1.4 52Measuring Inflation
WHAT YOU WILL LEARN
 How the inflation rate is measured
 What a price index is and how it is calculated
 The importance of the consumer price index and other price indexes
The Aggregate Price Level
In the fall of 2012, Americans were facing sticker shock at the gas pump: the price of a gallon of regular gasoline had risen from about $3.40 that spring, to $3.90—
The aggregate price level is a measure of the overall level of prices in the economy.
Clearly there is a need for a single number summarizing what happens to consumer prices. Just as macroeconomists find it useful to have a single number to represent the overall level of output, they also find it useful to have a single number to represent the overall level of prices: the aggregate price level. Yet a huge variety of goods and services are produced and consumed in the economy. How can we summarize the prices of all these goods and services with a single number? The answer lies in the concept of a price index—a concept best introduced with an example.
Market Baskets and Price Indexes
Suppose that a frost in Florida destroys most of the citrus harvest. As a result, the price of oranges rises from $0.20 each to $0.40 each, the price of grapefruit rises from $0.60 to $1.00, and the price of lemons rises from $0.25 to $0.45. How much has the price of citrus fruit increased?
One way to answer that question is to state three numbers—
A market basket is a hypothetical set of consumer purchases of goods and services.
To measure average price changes for consumer goods and services, economists track changes in the cost of a typical consumer’s consumption bundle—the typical basket of goods and services purchased before the price changes. A hypothetical consumption bundle, used to measure changes in the overall price level, is known as a market basket. For our market basket in this example we will suppose that, before the frost, a typical consumer bought 200 oranges, 50 grapefruit, and 100 lemons over the course of a year.

Table 52-1 shows the pre-
52-1
Calculating the Cost of a Market Basket

A price index measures the cost of purchasing a given market basket in a given year. The index value is normalized so that it is equal to 100 in the selected base year.
Economists use the same method to measure changes in the overall price level: they track changes in the cost of buying a given market basket. Working with a market basket and a base year, we obtain what is known as a price index, a measure of the overall price level. It is always cited along with the year for which the aggregate price level is being measured and the base year. A price index can be calculated using the following formula:

In our example, the citrus fruit market basket cost $95 in the base year, the year before the frost. So by applying Equation 16-
You should note that applying Equation 16-
The price index makes it clear that the average price of citrus has risen 84.2% as a consequence of the frost. Because of its simplicity and intuitive appeal, the method we’ve just described is used to calculate a variety of price indexes to track average price changes among a variety of different groups of goods and services. Examples include the consumer price index and the producer price index, which we’ll discuss shortly.
Price indexes are also the basis for measuring inflation. The price level mentioned in the inflation rate formula in the previous module is simply a price index value, and the inflation rate is determined as the annual percent change in an official price index. The inflation rate from year 1 to year 2 is thus calculated using the following formula, with year 1 and year 2 being consecutive years.

Typically, a news report that cites “the inflation rate” is referring to the annual percent change in the consumer price index.
The Consumer Price Index
The consumer price index, or CPI, measures the cost of the market basket of a typical urban American family.
The most widely used measure of the overall price level in the United States is the consumer price index (often referred to simply as the CPI), which is intended to show how the cost of all purchases by a typical urban family has changed over time. It is calculated by surveying market prices for a market basket that is constructed to represent the consumption of a typical family of four living in a typical American city. The base period for the index is currently 1982–
The market basket used to calculate the CPI is far more complex than the three-

Every few years the Bureau of Labor Statistics updates the market basket used to calculate the CPI to reflect changes in the monthly purchases of the typical urban family of four. For example, food and beverages are now a smaller percentage of the basket, having gone from 21% in 1978 to 15% in 2012. In addition, as technology has changed over time, new goods are added to the basket, such as smart phones and tablets like the iPad.
Figure 52-2 shows how the CPI has changed since measurement began in 1913. Since 1940, the CPI has risen steadily, although the annual percent increases in recent years have been much smaller than those of the 1970s and early 1980s. A logarithmic scale is used so that equal percent changes in the CPI appear the same.

Nearly every country in the world calculates a consumer price index. As you might expect, the market baskets that make up these indexes differ quite a lot from country to country. In poor countries, where people must spend a high proportion of their income just to feed themselves, food makes up a large share of the price index. Among high-
Other Price Measures
The producer price index, or PPI, measures changes in the prices of goods and services purchased by producers.
There are two other price measures that are also widely used to track economy-
The GDP deflator for a given year is 100 times the ratio of nominal GDP to real GDP in that year.
The other widely used price measure is the GDP deflator; it isn’t exactly a price index, although it serves the same purpose. Recall how we distinguished between nominal GDP (GDP in current prices) and real GDP (GDP calculated using the prices of a base year). The GDP deflator for a given year is equal to 100 times the ratio of nominal GDP for that year to real GDP for that year expressed in prices of a selected base year. Since real GDP is currently expressed in 2005 dollars, the GDP deflator for 2005 is equal to 100. If nominal GDP doubles but real GDP does not change, the GDP deflator indicates that the aggregate price level doubled.
Perhaps the most important point about the different inflation rates generated by these three measures of prices is that they usually move closely together (although the producer price index tends to fluctuate more than either of the other two measures). Figure 52-3 shows the annual percent changes in the three indexes since 1930. By all three measures, the U.S. economy experienced deflation during the early years of the Great Depression, inflation during World War II, accelerating inflation during the 1970s, and a return to relative price stability in the 1990s.

Notice, by the way, the dramatic ups and downs in producer prices from 2000 through 2012 shown in Figure 52-3. This roller-
INDEXING TO THE CPI
Although GDP is a very important number for shaping economic policy, official statistics on GDP don’t have a direct effect on people’s lives. The CPI, by contrast, has a direct and immediate impact on millions of Americans. The reason is that many payments are tied, or “indexed,” to the CPI—
The practice of indexing payments to consumer prices goes back to the dawn of the United States as a nation. In 1780 the Massachusetts State Legislature recognized that the pay of its soldiers fighting the British needed to be increased because of inflation that occurred during the Revolutionary War. The legislature adopted a formula that made a soldier’s pay proportional to the cost of a market basket consisting of 5 bushels of corn,  pounds of beef, 10 pounds of sheep’s wool, and 16 pounds of sole leather.
Today, over 56 million people, most of them old or disabled, receive checks from Social Security, a national retirement program that accounts for almost a quarter of current total federal spending—

In addition, all Social Security payments are adjusted each year to offset any increase in consumer prices over the previous year. The CPI is used to calculate the official estimate of the inflation rate used to adjust these payments yearly. So every percentage point added to the official estimate of the rate of inflation adds 1% to the checks received by tens of millions of individuals.
Other government payments are also indexed to the CPI. In addition, income tax brackets, the bands of income levels that determine a taxpayer’s income tax rate, are indexed to the CPI. (An individual in a higher income bracket pays a higher income tax rate in a progressive tax system like ours.) Indexing also extends to the private sector, where many private contracts, including some wage settlements, contain cost-
Because the CPI plays such an important and direct role in people’s lives, it’s a politically sensitive number. The Bureau of Labor Statistics, which calculates the CPI, takes great care in collecting and interpreting price and consumption data. It uses a complex method in which households are surveyed to determine what they buy and where they shop, and a carefully selected sample of stores are surveyed to get representative prices.
52
Solutions appear at the back of the book.
Check Your Understanding
Consider Table 52-1 but suppose that the market basket is composed of 100 oranges, 50 grapefruit, and 200 lemons. How does this change the pre-
frost and post- frost consumer price indexes? Explain. Generalize your answer to explain how the construction of the market basket affects the CPI. Pre–frost, this market basket costs (100 × $0.20) + (50 × $0.60) + (200 × $0.25) = $20 + $30 + $50 = $100. The same market basket, post-frost, costs (100 × $0.40) + (50 × $1.00) + (200 × $0.45) = $40 + $50 + $90 = $180. So the price index is ($100/$100) × 100 = 100 before the frost and ($180/$100) × 100 = 180 after the frost, implying a rise in the price index of 80%. This increase in the price index is less than the 84.2% increase calculated in the text. The reason for this difference is that the new market basket of 100 oranges, 50 grapefruit, and 200 lemons contains proportionately more of an item that has experienced a relatively small price increase (the lemons, the price of which has increased by 80%) and proportionately fewer of an item that has experienced a relatively large price increase (the oranges, the price of which has increased by 100%). This shows that the price index can be very sensitive to the composition of the market basket. If the market basket contains a large proportion of goods whose prices have risen faster than the prices of other goods, it will lead to a higher estimate of the increase in the price level. If it contains a large proportion of goods whose prices have risen more slowly than the prices of other goods, it will lead to a lower estimate of the increase in the price level.For each of the following events, explain how the use of a 10-
year- old market basket would bias measurements of price changes over the past decade. -
a. A typical family owns more cars than it would have a decade ago. Over that time, the average price of a car has increased more than the average prices of other goods.
A market basket determined 10 years ago will contain fewer cars than at present. Given that the average price of a car has grown faster than the average prices of other goods, this basket will underestimate the true increase in the price level because it contains relatively too few cars. -
b. Virtually no households had Internet access a decade ago. Now many households have it, and the price has been falling.
A market basket determined 10 years ago will not contain Internet access, so it cannot track the fall in prices of Internet access over the past few years. As a result, it will overestimate the true increase in the price level.
-
The consumer price index in the United States (base period 1982–
1984) was 224.9 in 2011 and 229.6 in 2012. Calculate the inflation rate from 2011 to 2012. Using Equation 16-2, the inflation rate from 2011 to 2012 is (229.6 − 224.9)/224.9 × 100 = 2.1%.
Multiple-
Question
If the cost of a market basket of goods increases from $100 in year 1 to $108 in year 2, what is the consumer price index in year 2 if year 1 is the base year?
A. B. C. D. E. Question
If the consumer price index increases from 80 to 120 from one year to the next, the inflation rate over that time period was
A. B. C. D. E. Question
Which of the following is true of the CPI?
I. It is the most common measure of the price level.
II. It measures the price of a typical market basket of goods.
III. It currently uses a base period of 1982–1984. A. B. C. D. E. Question
The value of a price index in the base year is
A. B. C. D. E. Question
If your wage doubles at the same time as the consumer price index goes from 100 to 300, your real wage
A. B. C. D. E.
Critical-
The accompanying table contains the values of two price indexes for the years 2010, 2011, and 2012: the GDP deflator and the CPI. For each price index, calculate the inflation rate from 2010 to 2011 and from 2011 to 2012.
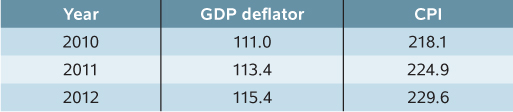
To calculate the inflation rate from 2010 to 2011 using either the GDP deflator or the CPI, start with the 2011 price index value and subtract the 2010 price index value to find the change in the price index. Divide this change in the price index by the 2011 value and then multiply by 100. Do the same to calculate the inflation rate from 2011 to 2012. The results are shown in the following table.
| Year | GDP Deflator | CPI |
|---|---|---|
| 2010–2011 | (2.4/111.0) × 100 = 2.2% | (6.8/218.1) × 100 = 3.1% |
| 2011–2012 | (2.0/113.4) × 100 = 1.8% | (4.7/224.9) × 100 = 2.1% |