1.1 53Sources of Long-Run Economic Growth
Kaband/Shutterstock
WHAT YOU WILL LEARN
 How to measure long-
run economic growth  How real GDP has changed over time and how it varies across countries
 The sources of long-
run economic growth
Comparing Economies Across Time and Space
Before we analyze the sources of long-
Real GDP per Capita
The key statistic used to track economic growth is real GDP per capita—real GDP divided by the population size. We focus on GDP because, as we learned, GDP measures the total value of an economy’s production of final goods and services as well as the income earned in that economy in a given year. We use real GDP because we want to separate changes in the quantity of goods and services from the effects of a rising price level. We focus on real GDP per capita because we want to isolate the effect of changes in the population. For example, other things equal, an increase in the population lowers the standard of living for the average person—
Although we also learned that growth in real GDP per capita should not be a policy goal in and of itself, it does serve as a very useful summary measure of a country’s economic progress over time. Figure 53-1 shows real GDP per capita for the United States, India, and China, measured in 1990 dollars, from 1900 to 2010. The vertical axis is drawn on a logarithmic scale so that equal percent changes in real GDP per capita across countries are the same size in the graph.

To give a sense of how much the U.S. economy grew during the last century, Table 53-1 shows real GDP per capita at selected years, expressed two ways: as a percentage of the 1900 level and as a percentage of the 2010 level. In 1920, the U.S. economy already produced 136% as much per person as it did in 1900. In 2010, it produced 745% as much per person as it did in 1900, a more than sevenfold increase. Alternatively, in 1900 the U.S. economy produced only 13% as much per person as it did in 2010.
53-1
U.S. Real GDP per Capita

The income of the typical family normally grows more or less in proportion to per capita income. For example, a 1% increase in real GDP per capita corresponds, roughly, to a 1% increase in the income of the median or typical family—
Yet about 50% of the world’s people live in countries with a lower standard of living than the United States had a century ago. That’s the message about China and India in Figure 53-1: despite dramatic economic growth in China over the last three decades and the less dramatic acceleration of economic growth in India, China has only recently exceeded the standard of living that the United States enjoyed in the early twentieth century, while India is still poorer than the United States was at that time. And much of the world today is poorer than China or India.
You can get a sense of how poor much of the world remains by looking at Figure 53-2, a map of the world in which countries are classified according to their 2010 levels of GDP per capita, in U.S. dollars. As you can see, large parts of the world have very low incomes. Generally speaking, the countries of Europe and North America, as well as a few in the Pacific, have high incomes. The rest of the world, containing most of its population, is dominated by countries with GDP less than $3,976 per capita—

Growth Rates
How did the United States manage to produce over seven times as much per person in 2010 than in 1900? The answer is a little bit at a time. Long-
To have a sense of the relationship between the annual growth rate of real GDP per capita and the long-
According to the Rule of 70, the time it takes a variable that grows gradually over time to double is approximately 70 divided by that variable’s annual growth rate.

(Note that the Rule of 70 can only be applied to a positive growth rate.) So if real GDP per capita grows at 1% per year, it will take 70 years to double. If it grows at 2% per year, it will take only 35 years to double.
In fact, U.S. real GDP per capita rose on average 1.9% per year over the last century. Applying the Rule of 70 to this information implies that it should have taken 37 years for real GDP per capita to double; it would have taken 111 years—
Figure 53-3 shows the average annual rate of growth of real GDP per capita for selected countries from 1980 to 2010. Some countries were notable success stories: for example, China, though still quite a poor country, has made spectacular progress. India, although not matching China’s performance, has also achieved impressive growth, as discussed in the following Economics in Action.

*Data for Zimbabwe is average annual growth rate 2000–
Some countries, though, have had very disappointing growth. Argentina was once considered a wealthy nation. In the early years of the twentieth century, it was in the same league as the United States and Canada. But since then it has lagged far behind more dynamic economies. And still others, like Zimbabwe, have slid backward.
What explains these differences in growth rates? To answer that question, we need to examine the sources of long-
INDIA TAKES OFF
India achieved independence from Great Britain in 1947, becoming the world’s most populous democracy—
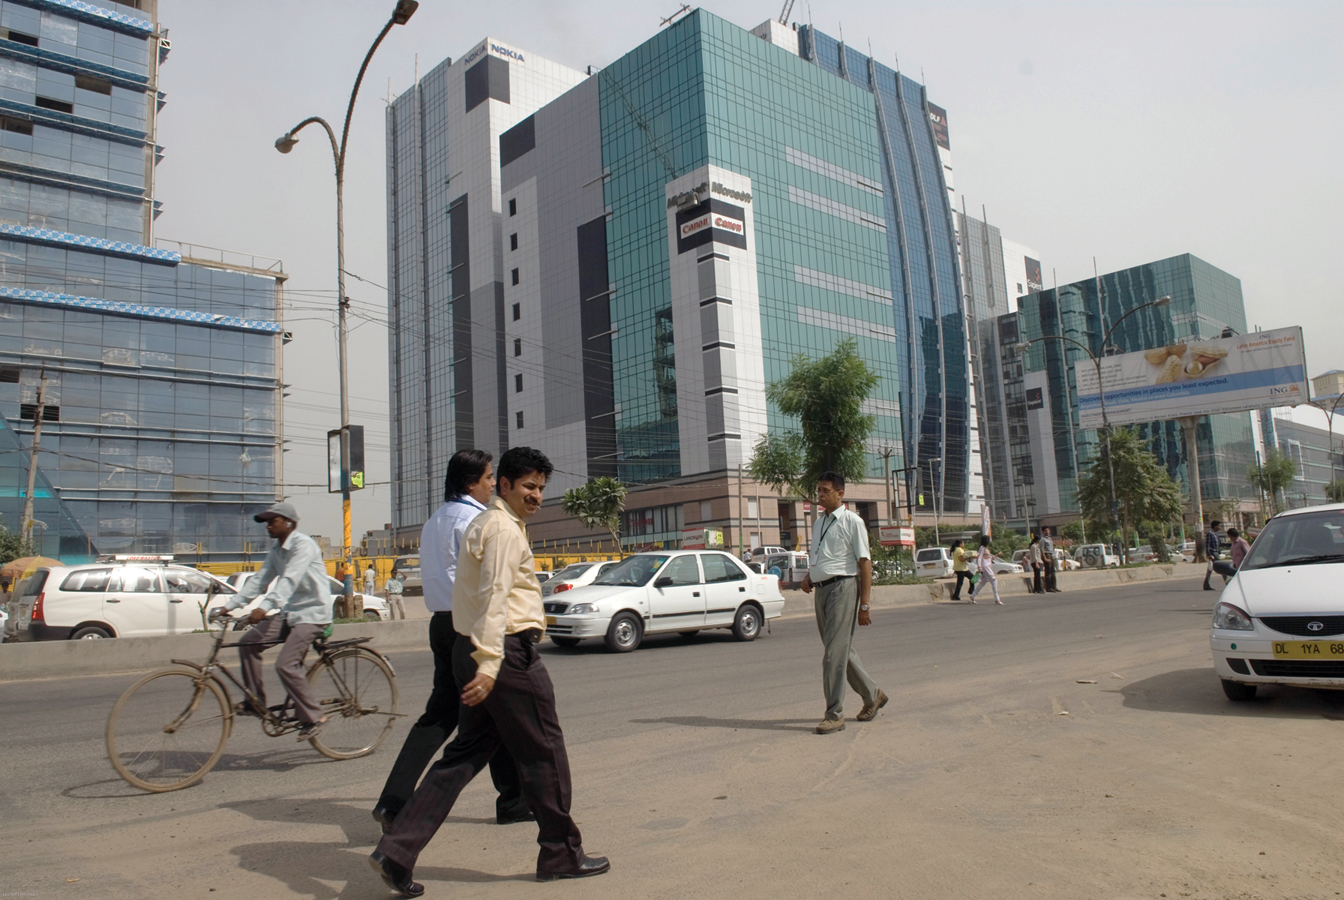
Since then, however, India has done much better. As Figure 53-3 shows, real GDP per capita has grown at an average rate of 4.2% a year, more than tripling between 1980 and 2010. India now has a large and rapidly growing middle class. And yes, the well-
What went right in India after 1980? Many economists point to policy reforms. For decades after independence, India had a tightly controlled, highly regulated economy. Today, things are very different: a series of reforms opened the economy to international trade and freed up domestic competition. Some economists, however, argue that this can’t be the main story because the big policy reforms weren’t adopted until 1991, yet growth accelerated around 1980.
Regardless of the explanation, India’s economic rise has transformed it into a major new economic power—
The big question now is whether this growth can continue. Skeptics argue that there are bottlenecks in the Indian economy that may constrain future growth. They point to the still low education level of much of India’s population and inadequate infrastructure—
What Are the Sources of Long-Run Growth?
Long-
The Crucial Importance of Productivity
Labor productivity, often referred to simply as productivity, is output per worker.
Sustained economic growth occurs only when the amount of output produced by the average worker increases steadily. The term labor productivity, or productivity for short, is used to refer either to output per worker or, in some cases, to output per hour. (The number of hours worked by an average worker differs to some extent across countries, although this isn’t an important factor in the difference between living standards in, say, India and the United States.)
In this book we’ll focus on output per worker. For the economy as a whole, productivity—
You might wonder why we say that higher productivity is the only source of long-
That happened in the United States during World War II, when millions of women who previously worked only in the home entered the paid workforce. The percentage of adult civilians employed outside the home rose from 50% in 1941 to 58% in 1944, and you can see the resulting bump in real GDP per capita during those years in Figure 53-1.
Over the longer run, however, the rate of employment growth is never very different from the rate of population growth. Over the course of the twentieth century, for example, the population of the United States rose at an average rate of 1.3% per year and employment rose 1.5% per year. Real GDP per capita rose 1.9% per year; of that, 1.7%—that is, almost 90% of the total—
So increased productivity is the key to long-
Explaining Growth in Productivity
There are three main reasons why the average U.S. worker today produces far more than his or her counterpart a century ago. First, the modern worker has far more physical capital, such as machinery and office space, to work with. Second, the modern worker is much better educated and so possesses much more human capital. Finally, modern firms have the advantage of a century’s accumulation of technical advancements reflecting a great deal of technological progress.
Let’s look at each of these factors in turn.
Physical capital consists of human-
Increase in Physical CapitalEconomists define physical capital as manufactured resources such as buildings and machines. Physical capital makes workers more productive. For example, a worker operating a backhoe can dig a lot more feet of trench per day than one equipped only with a shovel.
The average U.S. private-
Human capital is the improvement in labor created by the education and knowledge embodied in the workforce.
Increase in Human CapitalIt’s not enough for a worker to have good equipment—
The human capital of the United States has increased dramatically over the past century. A century ago, although most Americans were able to read and write, very few had an extensive education. In 1910, only 13.5% of Americans over 25 had graduated from high school and only 3% had four-
Analyses based on growth accounting, described in the next module, suggest that education—
Technological progress is an advance in the technical means of the production of goods and services.
Technological ProgressProbably the most important driver of productivity growth is technological progress, which is broadly defined as an advance in the technical means of the production of goods and services. We’ll see shortly how economists measure the impact of technology on growth.

Workers today are able to produce more than those in the past, even with the same amount of physical and human capital, because technology has advanced over time. It’s important to realize that economically important technological progress need not be flashy or rely on cutting-
53
Solutions appear at the back of the book.
Check Your Understanding
Why do economists focus on real GDP per capita as a measure of economic progress rather than on some other measure, such as nominal GDP per capita or real GDP?
Economists want a measure of economic progress that rises with increases in the living standard of the average resident of a country. An increase in overall real GDP does not accurately reflect an increase in an average resident’s living standard because it does not account for growth in the number of residents. If, for example, real GDP rises by 10% but population grows by 20%, the living standard of the average resident falls: after the change, the average resident has only (110/120) × 100 = 91.6% as much real income as before the change. Similarly, an increase in nominal GDP per capita does not accurately reflect an increase in living standards because it does not account for any change in prices. For example, a 5% increase in nominal GDP per capita generated by a 5% increase in prices results in no change in living standards. Real GDP per capita is the only measure that accounts for both changes in the population and changes in prices.Apply the Rule of 70 to the data in Figure 53-3 to determine how long it will take each of the countries listed there to double its real GDP per capita. Would India’s real GDP per capita exceed that of the United States in the future if growth rates remained the same? Why or why not?
Using the Rule of 70, the amount of time it will take China to double its real GDP per capita is (70/8.9) = 7.9 years; India, (70/4.2) = 16.7 years; Ireland, (70/3.1) = 22.6 years; the United States, (70/1.7) = 41.2 years; France, (70/1.3) = 53.8 years; and Argentina (70/1.2) = 58.3 years. Since the Rule of 70 can be applied to only a positive growth rate, we cannot apply it to the case of Zimbabwe, which experienced negative growth. If India continues to have a higher growth rate of real GDP per capita than the United States, then India’s real GDP per capita will eventually surpass that of the United States.Although China and India currently have growth rates much higher than the U.S. growth rate, the typical Chinese or Indian household is far poorer than the typical American household. Explain why.
The United States began growing rapidly over a century ago, but China and India have begun growing rapidly only recently. As a result, the living standard of the typical Chinese or Indian household has not yet caught up with that of the typical American household.
Multiple-
Question
Which of the following is true regarding growth rates for countries around the world compared to the United States?
I. Fifty percent of the world’s people live in countries with a lower standard of living than the U.S. in 1900.
II. The U.S. growth rate is six times the growth rate in the rest of the world.
III. China has only just attained the same standard of living the U.S. had in 1900.A. B. C. D. E. Question
Which of the following is the key statistic used to track economic growth?
A. B. C. D. E. Question
According to the Rule of 70, if a country’s real GDP per capita grows at a rate of 2% per year, it will take how many years for real GDP per capita to double?
A. B. C. D. E. Question
If a country’s real GDP per capita doubles in 10 years, what was its average annual rate of growth of real GDP per capita?
A. B. C. D. E. Question
Long-
run economic growth depends almost entirely on A. B. C. D. E.
Critical-
Question 1.1
Increases in real GDP per capita result mostly from changes in what variable? Define that variable. What other factor could also lead to increased real GDP per capita? Why is this other factor not as significant?
CHANGE IN LEVEL VERSUS RATE OF CHANGE
 What’s the difference between a change in the level of real GDP and a change in the growth rate?
 When you hear that real GDP “grew,” it means that the level of real GDP increased. When you hear statements about economic growth over a period of years, you are almost always hearing about changes in the growth rate. Consider this example. We might say that U.S. real GDP grew during 2010 by $385 billion. If we knew the level of U.S. real GDP in 2009, we could also represent the amount of 2010 growth in terms of a rate of change. So, if U.S. real GDP in 2009 was $12,703 billion, then U.S. real GDP in 2010 was $12,703 billion + $385 billion = $13,088 billion. We could calculate the rate of change, or the growth rate, of U.S. real GDP during 2010 as: ($13,088 billion − $12,703 billion)/$12,703 billion) × 100 ($385 billion/$12,703 billion) × 100 = 3.03%.
When talking about growth or growth rates, economists often use phrases that appear to mix the two concepts. Admittedly, this can be confusing. For example, when economists say that “U.S. growth fell during the 1970s,” they are really saying that the U.S. growth rate of real GDP was lower in the 1970s in comparison to the 1960s. When they say that “growth accelerated during the early 1990s,” what they mean is that the growth rate increased year after year in the early 1990s—
To learn more, see pages 174 and 175.
