PROBLEMS
Question 15.13
Go to the FOMC page of the Federal Reserve Board’s website (www.federalreserve.gov/
FOMC/ ) to find the statement issued after the most recent FOMC meeting. (Click on “Meeting calendars and information” and then click on the most recent statement listed in the calendar.)What is the target federal funds rate?
Is the target federal funds rate different from the target federal funds rate in the previous FOMC statement? If yes, by how much does it differ?
Does the statement comment on current macroeconomic conditions in the United States? How does it describe the U.S. economy?
Question 15.14
How will the following events affect the demand for money? In each case, specify whether there is a shift of the demand curve or a movement along the demand curve and its direction.
There is a fall in the interest rate from 12% to 10%.
Thanksgiving arrives and, with it, the beginning of the holiday shopping season.
McDonald’s and other fast-
food restaurants begin to accept credit cards. The Fed engages in an open-
market purchase of U.S. Treasury bills.
Question 15.15
Go to www.treasurydirect.gov. Under “Individuals,” go to “Treasury Securities & Programs.” Click on “Treasury bills.” Under “at a glance,” click on “rates in recent auctions.” What is the investment rate for the most recently issued 26-
week T- bills? Go to the website of your favorite bank. What is the interest rate for six-
month CDs? Why are the rates for six-
month CDs higher than for 26- week Treasury bills?
Question 15.16
Go to www.treasurydirect.gov. Under “Individuals,” go to “Treasury Securities & Programs.” Click on “Treasury notes.” Under “at a glance,” click on “rates in recent auctions.” Use the list of Recent Note, Bond, and TIPS Auction Results to answer the following questions.
What are the interest rates on 2-
year and 10- year notes? How do the interest rates on the 2-
year and 10- year notes relate to each other? Why is the interest rate on the 10- year note higher (or lower) than the interest rate on the 2- year note?
Question 15.17
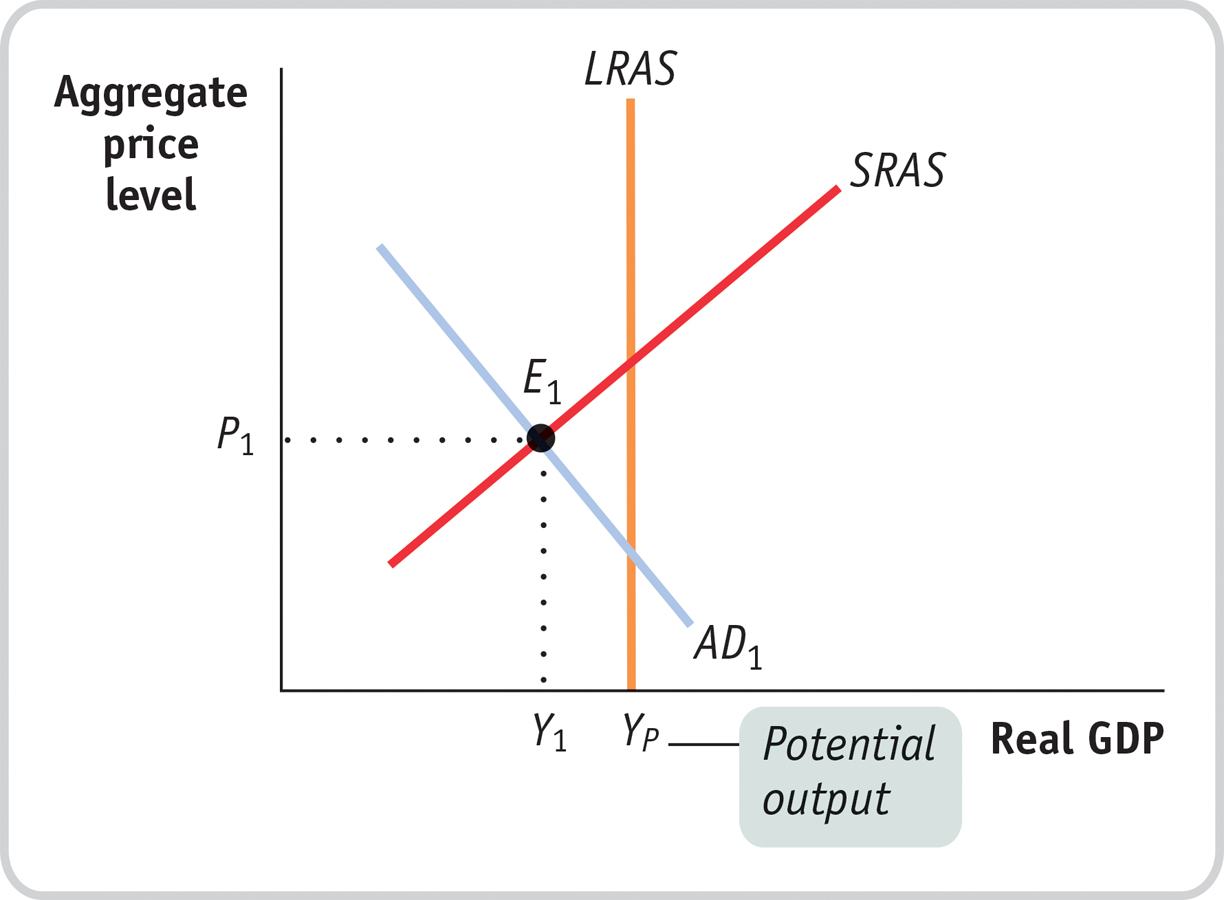
An economy is facing the recessionary gap shown in the accompanying diagram. To eliminate the gap, should the central bank use expansionary or contractionary monetary policy? How will the interest rate, investment spending, consumer spending, real GDP, and the aggregate price level change as monetary policy closes the recessionary gap?
Question 15.18
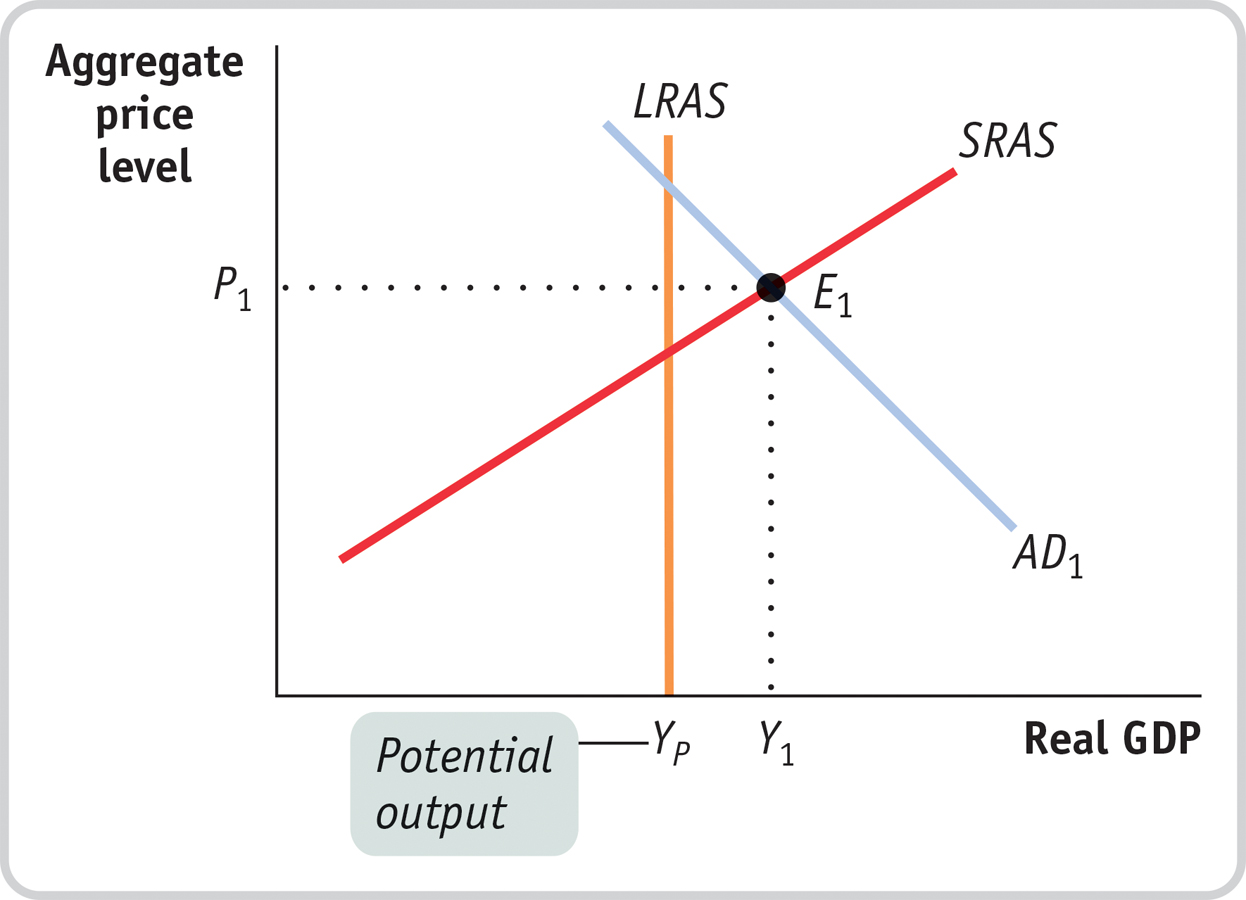
An economy is facing the inflationary gap shown in the accompanying diagram. To eliminate the gap, should the central bank use expansionary or contractionary monetary policy? How will the interest rate, investment spending, consumer spending, real GDP, and the aggregate price level change as monetary policy closes the inflationary gap?
Question 15.19
In the economy of Eastlandia, the money market is initially in equilibrium when the economy begins to slide into a recession.
Using the accompanying diagram, explain what will happen to the interest rate if the central bank of Eastlandia keeps the money supply constant at —M1.
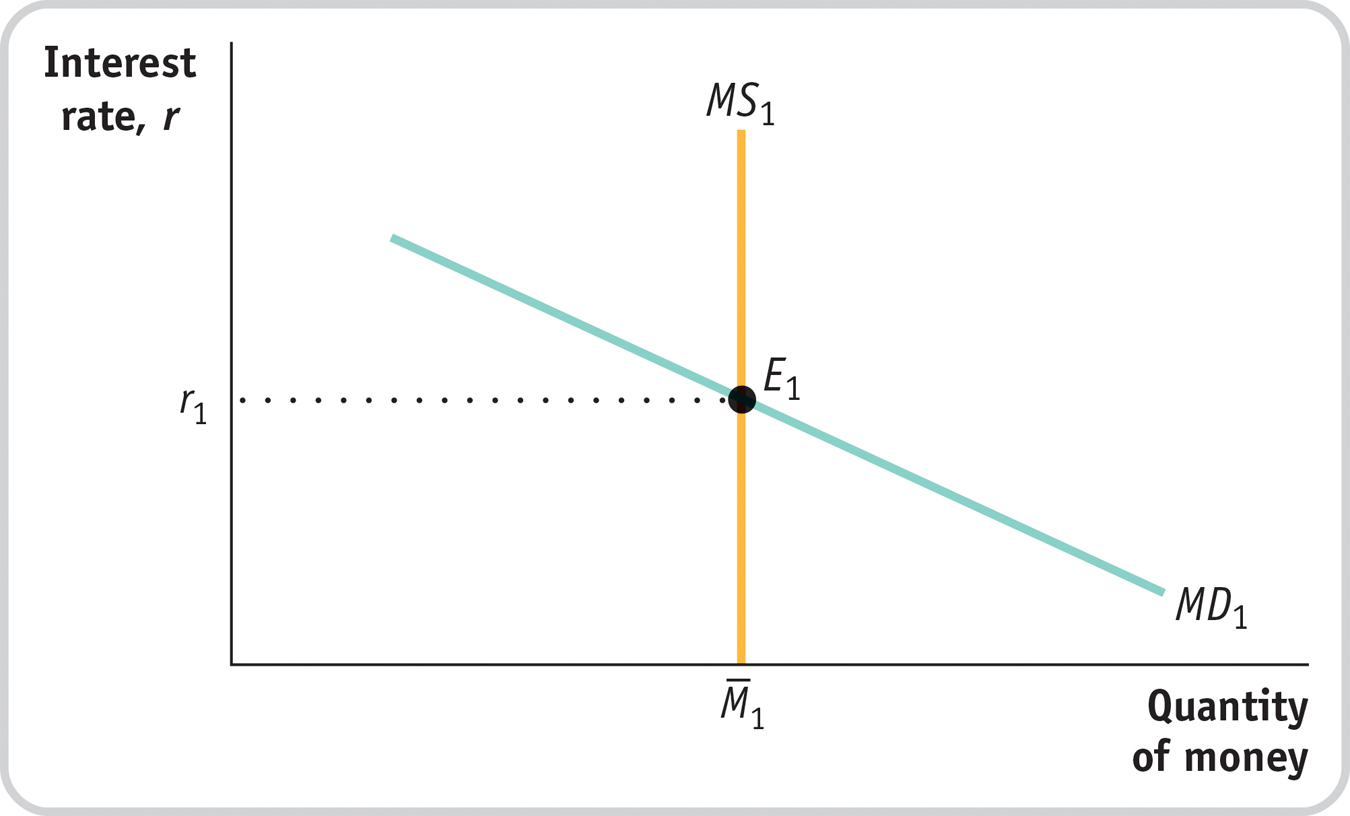
If the central bank is instead committed to maintaining an interest rate target of r1, then as the economy slides into recession, how should the central bank react? Using your diagram from part a, demonstrate the central bank’s reaction.
Question 15.20
Suppose that the money market in Westlandia is initially in equilibrium and the central bank decides to decrease the money supply.
Using a diagram like the one in Problem 7, explain what will happen to the interest rate in the short run.
What will happen to the interest rate in the long run?
Question 15.21
An economy is in long-
run macroeconomic equilibrium with an unemployment rate of 5% when the government passes a law requiring the central bank to use monetary policy to lower the unemployment rate to 3% and keep it there. How could the central bank achieve this goal in the short run? What would happen in the long run? Illustrate with a diagram. Question 15.22
According to the European Central Bank website, the treaty establishing the European Community “makes clear that ensuring price stability is the most important contribution that monetary policy can make to achieve a favourable economic environment and a high level of employment.” If price stability is the only goal of monetary policy, explain how monetary policy would be conducted during recessions. Analyze both the case of a recession that is the result of a demand shock and the case of a recession that is the result of a supply shock.
Question 15.23
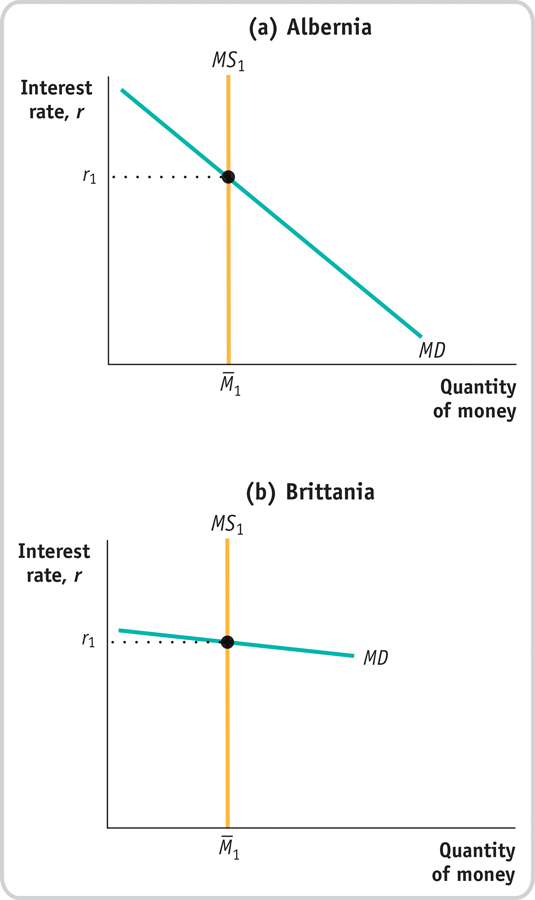
The effectiveness of monetary policy depends on how easy it is for changes in the money supply to change interest rates. By changing interest rates, monetary policy affects investment spending and the aggregate demand curve. The economies of Albernia and Brittania have very different money demand curves, as shown in the accompanying diagram. In which economy will changes in the money supply be a more effective policy tool? Why?
Question 15.24
During the Great Depression, businesspeople in the United States were very pessimistic about the future of economic growth and reluctant to increase investment spending even when interest rates fell. How did this limit the potential for monetary policy to help alleviate the Depression?
WORK IT OUT
For interactive, step-
Question 15.25
13. Because of the economic slowdown associated with the 2007–
Use the liquidity preference model to explain how the Federal Open Market Committee lowers the interest rate in the short run. Draw a typical graph that illustrates the mechanism. Label the vertical axis “Interest rate” and the horizontal axis “Quantity of money.” Your graph should show two interest rates, r1 and r2.
Explain why the reduction in the interest rate causes aggregate demand to increase in the short run.
Suppose that in 2015 the economy is at potential output but that this is somehow overlooked by the Fed, which continues its monetary expansion. Demonstrate the effect of the policy measure on the AD curve. Use the LRAS curve to show that the effect of this policy measure on the AD curve, other things equal, causes the aggregate price level to rise in the long run. Label the vertical axis “Aggregate price level” and the horizontal axis “Real GDP.”