Deficits and Debt in Practice
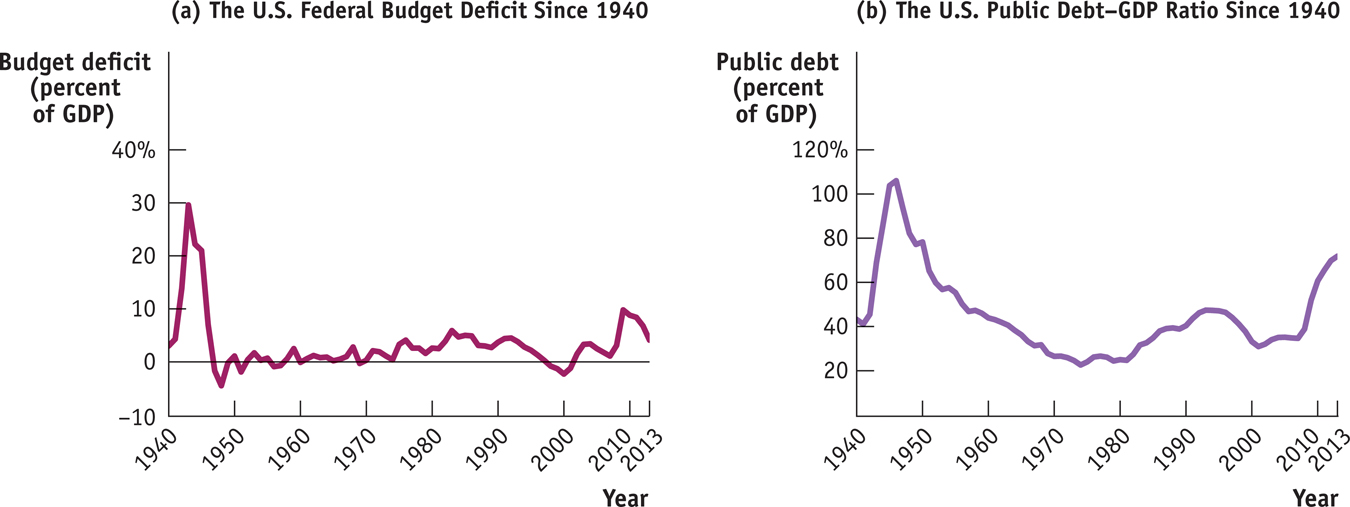
Figure 13-12 shows the U.S. federal government’s budget deficit and its debt evolved from 1940 to 2013. Panel (a) shows the federal deficit as a percentage of GDP. As you can see, the federal government ran huge deficits during World War II. It briefly ran surpluses after the war, but it has normally run deficits ever since, especially after 1980. This seems inconsistent with the advice that governments should offset deficits in bad times with surpluses in good times.

U.S. Federal Deficits and Debt Panel (a) shows the U.S. federal budget deficit as a percentage of GDP from 1940 to 2013. The U.S. government ran huge deficits during World War II and has run smaller deficits ever since. Panel (b) shows the U.S. debt–GDP ratio. Comparing panels (a) and (b), you can see that in many years the debt–GDP ratio has declined in spite of government deficits. This seeming paradox reflects the fact that the debt–GDP ratio can fall, even when debt is rising, as long as GDP grows faster than debt. Source: Office of Management and Budget.
The debt–GDP ratio is the government’s debt as a percentage of GDP.
However, panel (b) of Figure 13-12 shows that for most of the period these persistent deficits didn’t lead to runaway debt. To assess the ability of governments to pay their debt, we use the debt–GDP ratio, the government’s debt as a percentage of GDP. We use this measure, rather than simply looking at the size of the debt, because GDP, which measures the size of the economy as a whole, is a good indicator of the potential taxes the government can collect. If the government’s debt grows more slowly than GDP, the burden of paying that debt is actually falling compared with the government’s potential tax revenue.
What we see from panel (b) is that although the federal debt grew in almost every year, the debt–GDP ratio fell for 30 years after the end of World War II. This shows that the debt–GDP ratio can fall, even when debt is rising, as long as GDP grows faster than debt. The upcoming For Inquiring Minds, which focuses on the large debt the U.S. government ran up during World War II, explains how growth and inflation sometimes allow a government that runs persistent budget deficits to nevertheless have a declining debt–GDP ratio.
What Happened to the Debt from World War II?
As you can see from Figure 13-12, the U.S. government paid for World War II by borrowing on a huge scale. By the war’s end, the public debt was more than 100% of GDP, and many people worried about how it could ever be paid off.
The truth is that it never was paid off. In 1946 public debt was $242 billion; that number dipped slightly in the next few years, as the United States ran postwar budget surpluses, but the government budget went back into deficit in 1950 with the start of the Korean War. By 1962 the public debt was back up to $248 billion.
But by that time nobody was worried about the fiscal health of the U.S. government because the debt–GDP ratio had fallen by more than half. The reason? Vigorous economic growth, plus mild inflation, had led to a rapid rise in GDP. The experience was a clear lesson in the peculiar fact that modern governments can run deficits forever, as long as they aren’t too large.
Still, a government that runs persistent large deficits will have a rising debt–GDP ratio when debt grows faster than GDP. In the aftermath of the financial crisis of 2008, the U.S. government began running deficits much larger than anything seen since World War II, and the debt–GDP ratio began rising sharply. Similar surges in the debt–GDP ratio could be seen in a number of other countries in 2008. Economists and policy makers agreed that this was not a sustainable trend, that governments would need to get their spending and revenues back in line.
But when to bring spending in line with revenue was a source of great disagreement. Some argued for fiscal tightening right away; others argued that this tightening should be postponed until the major economies had recovered from their slump.
