The Business Cycle
The Great Depression was by far the worst economic crisis in U.S. history. But although the economy managed to avoid catastrophe for the rest of the twentieth century, it has experienced many ups and downs.
It’s true that the ups have consistently been bigger than the downs: a chart of any of the major numbers used to track the U.S. economy shows a strong upward trend over time. For example, panel (a) of Figure 6-2 shows total U.S. private-sector employment (the total number of jobs offered by private businesses) measured along the left vertical axis, with the data from 1985 to 2014 given by the purple line. The graph also shows the index of industrial production (a measure of the total output of U.S. factories) measured along the right vertical axis, with the data from 1985 to 2014 given by the red line. Both private-sector employment and industrial production were much higher at the end of this period than at the beginning, and in most years both measures rose.
6-2
U.S. Growth, Interrupted, 1985–2014
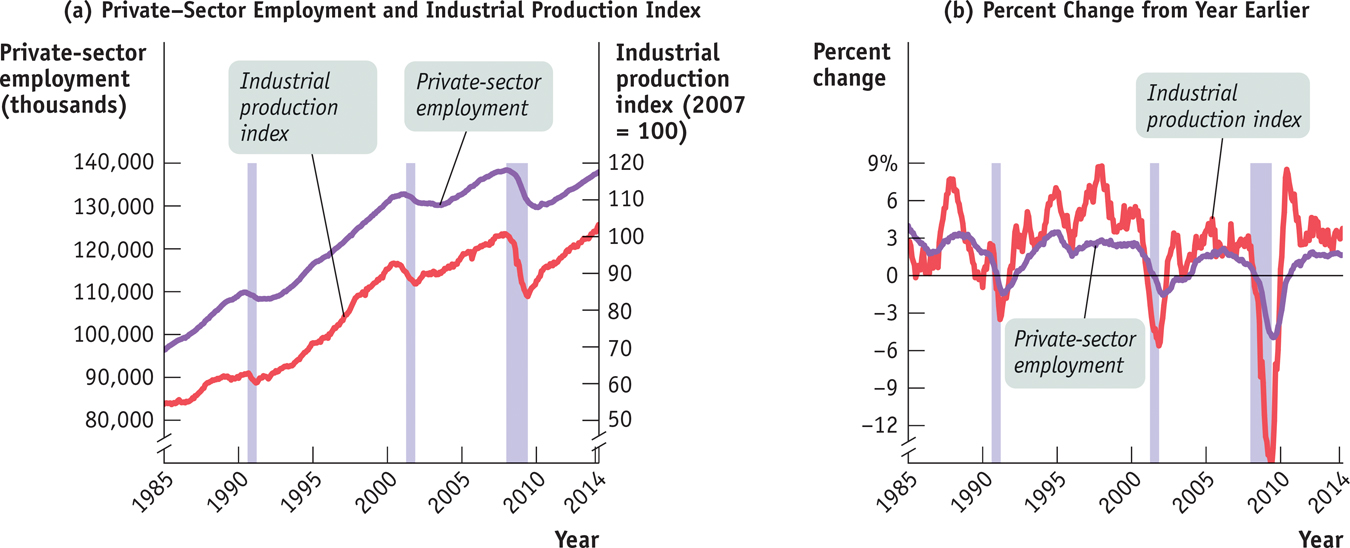
U.S. Growth, Interrupted, 1985–2014 Panel (a) shows two important economic numbers, the industrial production index and total private-sector employment. Both numbers grew substantially from 1985 to 2014, but they didn’t grow steadily. Instead, both suffered from three downturns associated with recessions, which are indicated by the shaded areas in the figure. Panel (b) emphasizes those downturns by showing the annual rate of change of industrial production and employment, that is, the percentage increase over the past year. The simultaneous downturns in both numbers during the three recessions are clear.
Source: Federal Reserve Bank of St. Louis.
But they didn’t rise steadily. As you can see from the figure, there were three periods—in the early 1990s, in the early 2000s, and again beginning in late 2007—when both employment and industrial output stumbled. Panel (b) emphasizes these stumbles by showing the rate of change of employment and industrial production over the previous year. For example, the percent change in employment for December 2007 was 0.7, because employment in December 2007 was 0.7% higher than it had been in December 2006. The three big downturns stand out clearly. What’s more, a detailed look at the data makes it clear that in each period the stumble wasn’t confined to only a few industries: in each downturn, just about every sector of the U.S. economy cut back on production and on the number of people employed.
The economy’s forward march, in other words, isn’t smooth. And the uneven pace of the economy’s progress, its ups and downs, is one of the main preoccupations of macroeconomics.