Charting the Business Cycle
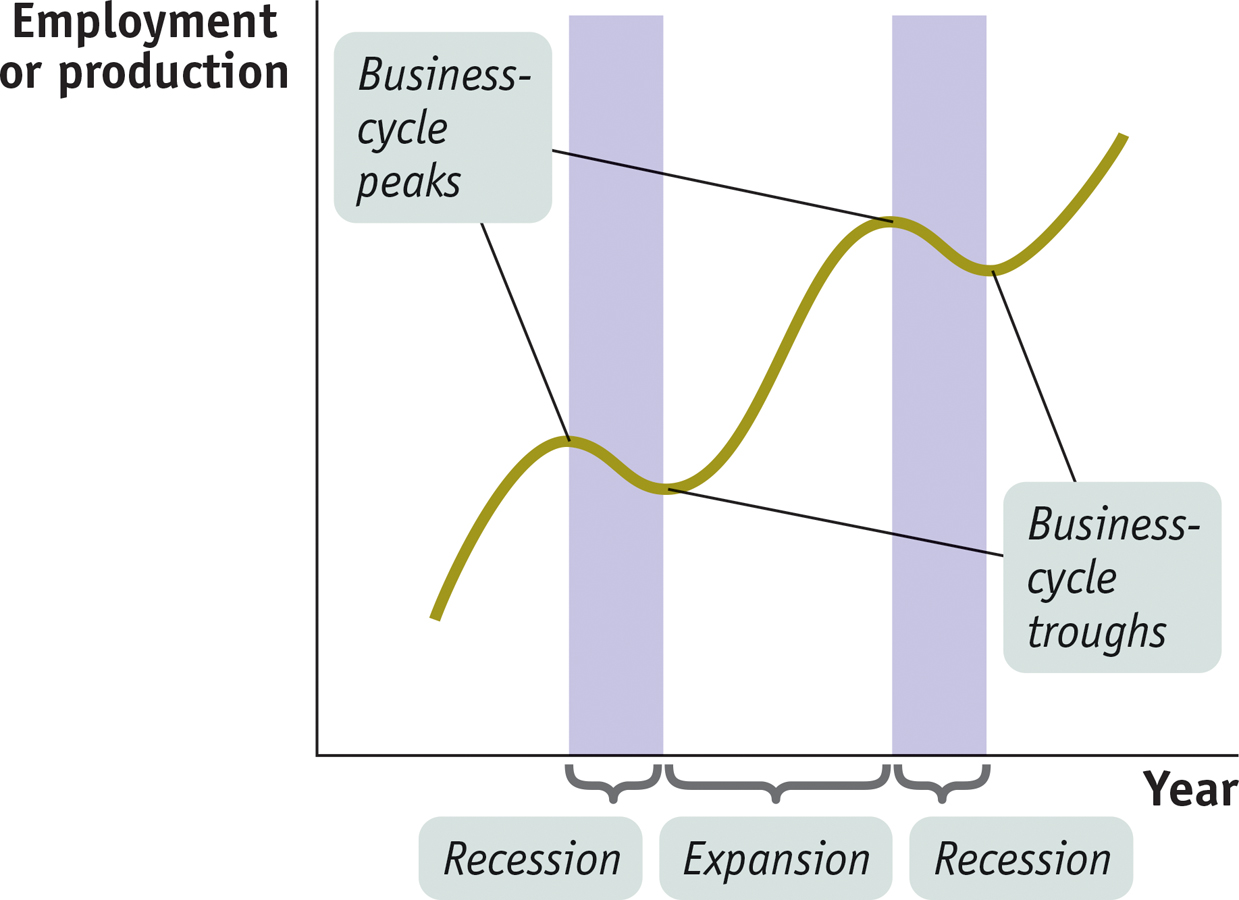
Figure 6-3 shows a stylized representation of the way the economy evolves over time. The vertical axis shows either employment or an indicator of how much the economy is producing, such as industrial production or real gross domestic product (real GDP), a measure of the economy’s overall output that we’ll learn about in the next chapter. As the data in Figure 6-2 suggest, these two measures tend to move together. Their common movement is the starting point for a major theme of macroeconomics: the economy’s alternation between short-
Recessions, or contractions, are periods of economic downturn when output and employment are falling.
Expansions, or recoveries, are periods of economic upturn when output and employment are rising.
The business cycle is the short-
The point at which the economy turns from expansion to recession is a business-
The point at which the economy turns from recession to expansion is a business-
A broad-
6-3
The Business Cycle
6-2
The History of the Business Cycle
|
Business- |
Business- |
|---|---|
|
no prior data available June 185 7October 1860 April 1865 June 1869 October 1873 |
December 1854 December 1858 June 1861 December 1867 December 1870 March 1879 |
|
March 1882 March 1887 July 1890 January 1893 December 1895 |
May 1885 April 1888 May 1891 June 1894 June 1897 |
|
June 1899 September 1902 May 1907 January 1910 January 1913 |
December 1900 August 1904 June 1908 January 1912 December 1914 |
|
August 1918 January 1920 May 1923 October 1926 August 1929 |
March 1919 July 1921 July 1924 November 1927 March 1933 |
|
May 1937 February 1945 November 1948 July 1953 August 1957 |
June 1938 October 1945 October 1949 May 1954 April 1958 |
|
April 1960 December 1969 November 1973 January 1980 July 1981 |
February 1961 November 1970 March 1975 July 1980 November 1982 |
|
July 1990 March 2001 December 2007 |
March 1991 November 2001 June 2009 |
|
Source: National Bureau of Economic Research. |
|
TABLE 6-
The alternation between recessions and expansions is known as the business cycle. The point in time at which the economy shifts from expansion to recession is known as a business-
The business cycle is an enduring feature of the economy. Table 6-2 shows the official list of business-