PROBLEMS
Question 7.12
At right is a simplified circular-
flow diagram for the economy of Micronia. (Note that there is no investment in Micronia.) 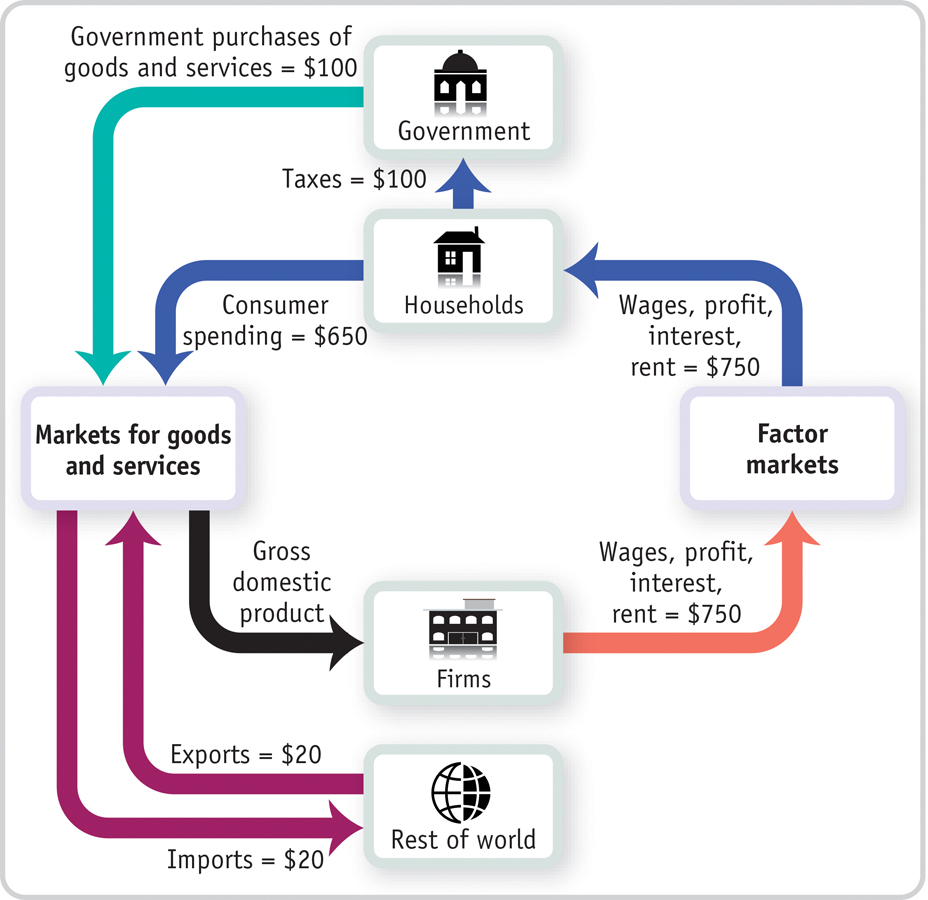
What is the value of GDP in Micronia?
What is the value of net exports?
What is the value of disposable income?
Does the total flow of money out of households—
the sum of taxes paid and consumer spending— equal the total flow of money into households? How does the government of Micronia finance its purchases of goods and services?
Question 7.13
A more complex circular-
flow diagram for the economy of Macronia is shown at right. (Note that Macronia has investment and financial markets.) 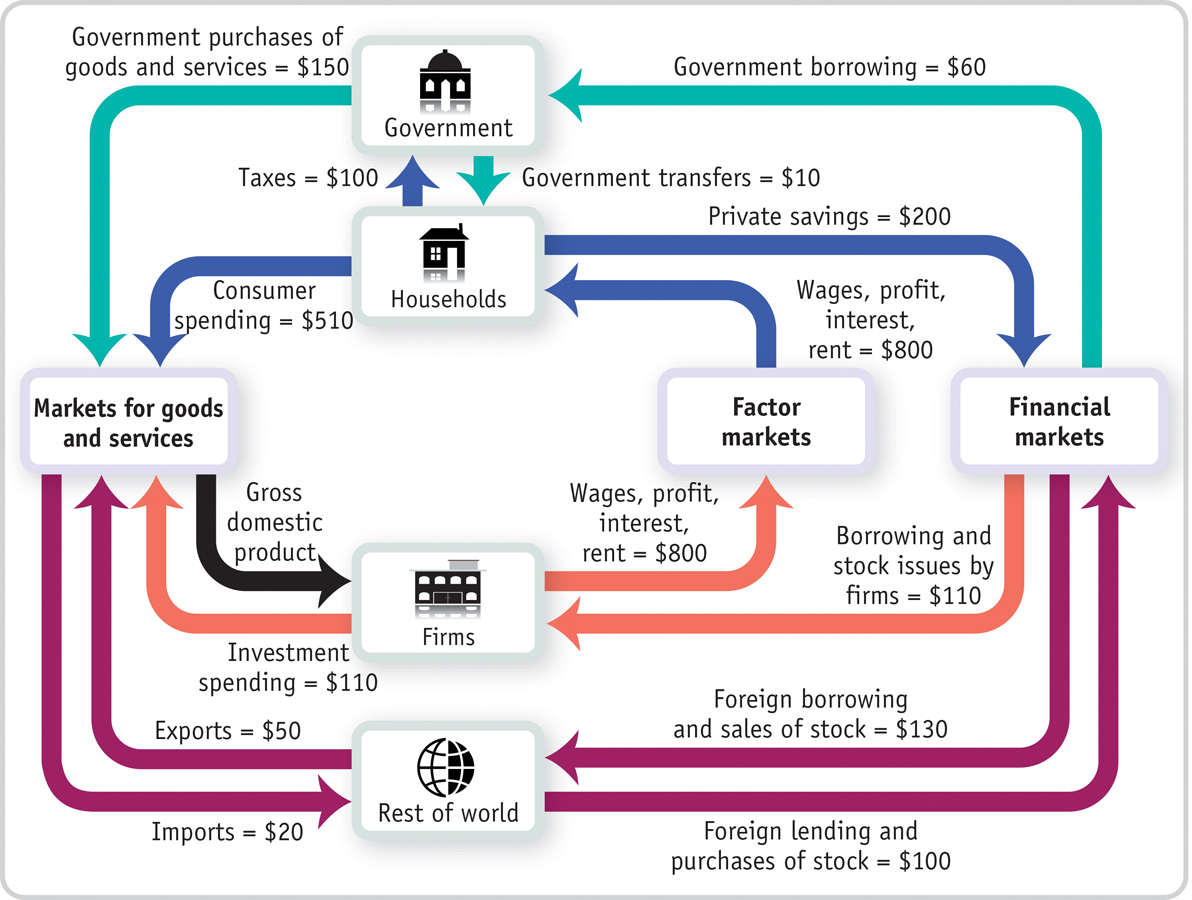
What is the value of GDP in Macronia?
What is the value of net exports?
What is the value of disposable income?
Does the total flow of money out of households—
the sum of taxes paid, consumer spending, and private savings— equal the total flow of money into households? How does the government finance its spending?
Question 7.14
The components of GDP in the accompanying table were produced by the Bureau of Economic Analysis.
Category
Components of GDP in 2013 (billions of dollars)
Consumer spending
Durable goods
$1,263.0
Nondurable goods
2,622.9
Services
7,615.7
Private investment spending
Fixed investment spending
2,564.0
Nonresidential
2,047.1
Structures
456.4
Equipment and intellectual property products
1,590.7
Residential
516.9
Change in private inventories
106.1
Net exports
Exports
2,259.9
Imports
2,757.2
Government purchases of goods and services and investment spending
Federal
1,245.9
National defense
770.7
Nondefense
475.1
State and local
1,879.6
Calculate 2013 consumer spending.
Calculate 2013 private investment spending.
Calculate 2013 net exports.
Calculate 2013 government purchases of goods and services and government investment spending.
Calculate 2013 gross domestic product.
Calculate 2013 consumer spending on services as a percentage of total consumer spending.
Calculate 2013 exports as a percentage of imports.
Calculate 2013 government purchases on national defense as a percentage of federal government purchases of goods and services.
Question 7.15
The small economy of Pizzania produces three goods (bread, cheese, and pizza), each produced by a separate company. The bread and cheese companies produce all the inputs they need to make bread and cheese, respectively. The pizza company uses the bread and cheese from the other companies to make its pizzas. All three companies employ labor to help produce their goods, and the difference between the value of goods sold and the sum of labor and input costs is the firm’s profit. The accompanying table summarizes the activities of the three companies when all the bread and cheese produced are sold to the pizza company as inputs in the production of pizzas.
Bread company
Cheese company
Pizza company
Cost of inputs
$0
$0
$50 (bread)
35 (cheese)
Wages
15
20
75
Value of output
50
35
200
Calculate GDP as the value added in production.
Calculate GDP as spending on final goods and services.
Calculate GDP as factor income.
Question 7.16
In the economy of Pizzania (from Problem 4), bread and cheese produced are sold both to the pizza company for inputs in the production of pizzas and to consumers as final goods. The accompanying table summarizes the activities of the three companies.
Bread company
Cheese company
Pizza company
Cost of inputs
$0
$0
$50 (bread)
35 (cheese)
Wages
25
30
75
Value of output
100
60
200
Calculate GDP as the value added in production.
Calculate GDP as spending on final goods and services.
Calculate GDP as factor income.
Question 7.17
Which of the following transactions will be included in GDP for the United States?
Coca-
Cola builds a new bottling plant in the United States. Delta sells one of its existing airplanes to Korean Air.
Ms. Moneybags buys an existing share of Disney stock.
A California winery produces a bottle of Chardonnay and sells it to a customer in Montreal, Canada.
An American buys a bottle of French perfume in Tulsa.
A book publisher produces too many copies of a new book; the books don’t sell this year, so the publisher adds the surplus books to inventories.
Question 7.18
The accompanying table shows data on nominal GDP (in billions of dollars), real GDP (in billions of 2005 dollars), and population (in thousands) of the United States in 1960, 1970, 1980, 1990, 2000, and 2010. The U.S. price level rose consistently over the period 1960–
2010. Year
Nominal GDP (billions of dollars)
Real GDP (billions of 2005 dollars)
Population (thousands)
1960
$526.4
$2,828.5
180,760
1970
1,038.5
4,266.3
205,089
1980
2,788.1
5,834.0
227,726
1990
5,800.5
8,027.1
250,181
2000
9,951.5
11,216.4
282,418
2010
14,526.5
13,088.0
310,106
Why is real GDP greater than nominal GDP for all years until 2000 and lower for 2010?
Calculate the percent change in real GDP from 1960 to 1970, 1970 to 1980, 1980 to 1990, 1990 to 2000, and 2000 to 2010. Which period had the highest growth rate?
Calculate real GDP per capita for each of the years in the table.
Calculate the percent change in real GDP per capita from 1960 to 1970, 1970 to 1980, 1980 to 1990, 1990 to 2000, and 2000 to 2010. Which period had the highest growth rate?
How do the percent change in real GDP and the percent change in real GDP per capita compare? Which is larger? Do we expect them to have this relationship?
Question 7.19
Eastland College is concerned about the rising price of textbooks that students must purchase. To better identify the increase in the price of textbooks, the dean asks you, the Economics Department’s star student, to create an index of textbook prices. The average student purchases three English, two math, and four economics textbooks per year. The prices of these books are given in the accompanying table.
2012
2013
2014
English textbook
$100
$110
$114
Math textbook
140
144
148
Economics textbook
160
180
200
What is the percent change in the price of an English textbook from 2012 to 2014?
What is the percent change in the price of a math textbook from 2012 to 2014?
What is the percent change in the price of an economics textbook from 2012 to 2014?
Using 2013 as a base year, create a price index for these books for all years.
What is the percent change in the price index from 2012 to 2014?
Question 7.20
The consumer price index, or CPI, measures the cost of living for a typical urban household by multiplying the price for each category of expenditure (housing, food, and so on) times a measure of the importance of that expenditure in the average consumer’s market basket and summing over all categories. However, using data from the consumer price index, we can see that changes in the cost of living for different types of consumers can vary a great deal. Let’s compare the cost of living for a hypothetical retired person and a hypothetical college student. Let’s assume that the market basket of a retired person is allocated in the following way: 10% on housing, 15% on food, 5% on transportation, 60% on medical care, 0% on education, and 10% on recreation. The college student’s market basket is allocated as follows: 5% on housing, 15% on food, 20% on transportation, 0% on medical care, 40% on education, and 20% on recreation. The accompanying table shows the March 2014 CPI for each of the relevant categories.
CPI March 2014
Housing
228.7
Food
239.7
Transportation
219.3
Medical care
436.5
Education
229.1
Recreation
115.7
Calculate the overall CPI for the retired person and for the college student by multiplying the CPI for each of the categories by the relative importance of that category to the individual and then summing each of the categories. The CPI for all items in March 2014 was 235.6. How do your calculations for a CPI for the retired person and the college student compare to the overall CPI?
Question 7.21
Go to the Bureau of Labor Statistics home page at www.bls.gov. Place the cursor over the “Economic Releases” tab and then click on “Major Economic Indicators” in the drop-
down menu that appears. Once on the “Major Economic Indicators” page, click on “Consumer Price Index.” On that page, under “Table of Contents,” click on “Table 1: Consumer Price Index for All Urban Consumers.” Using the “unadjusted” figures, determine what the CPI was for the previous month. How did it change from the previous month? How does the CPI compare to the same month one year ago? Question 7.22
The accompanying table provides the annual real GDP (in billions of 2009 dollars) and nominal GDP (in billions of dollars) for the United States.
2009
2010
2011
2012
2013
Real GDP (billions of 2009 dollars)
14,417.9
14,779.4
15,052.4
15,470.7
15,761.3
Nominal GDP (billions of dollars)
14,417.9
14,958.3
15,533.8
16,244.6
16,799.7
Calculate the GDP deflator for each year.
Use the GDP deflator to calculate the inflation rate for all years except 2009.
Question 7.23
The accompanying table contains two price indexes for the years 2011, 2012, and 2013: the GDP deflator and the CPI. For each price index, calculate the inflation rate from 2011 to 2012 and from 2012 to 2013.
Year
GDP deflator
CPI
2011
103.199
224.939
2012
105.002
229.594
2013
106.588
232.957
Question 7.24
The cost of a college education in the United States is rising at a rate faster than inflation. The following table shows the average cost of a college education in the United States during the academic year that began in 2011 and the academic year that began in 2012 for public and private colleges. Assume the costs listed in the table are the only costs experienced by the various college students in a single year.
Calculate the cost of living for an average college student in each category for 2011 and 2012.
Calculate an inflation rate for each type of college student between 2011 and 2012.
WORK IT OUT
For interactive, step-
Question 7.25
14. The economy of Britannica produces three goods: computers, DVDs, and pizza. The accompanying table shows the prices and output of the three goods for the years 2012, 2013, and 2014.
|
|
Computers |
DVDs |
Pizzas |
|||
|---|---|---|---|---|---|---|
|
Year |
Price |
Quantity |
Price |
Quantity |
Price |
Quantity |
|
2012 |
$900 |
10 |
$10 |
100 |
$15 |
2 |
|
2013 |
1,000 |
10.5 |
12 |
105 |
16 |
2 |
|
2014 |
1,050 |
12 |
14 |
110 |
17 |
3 |
What is the percent change in production of each of the goods from 2012 to 2013 and from 2013 to 2014?
What is the percent change in prices of each of the goods from 2012 to 2013 and from 2013 to 2014?
Calculate nominal GDP in Britannica for each of the three years. What is the percent change in nominal GDP from 2012 to 2013 and from 2013 to 2014?
Calculate real GDP in Britannica using 2012 prices for each of the three years. What is the percent change in real GDP from 2012 to 2013 and from 2013 to 2014?