Growth and Unemployment
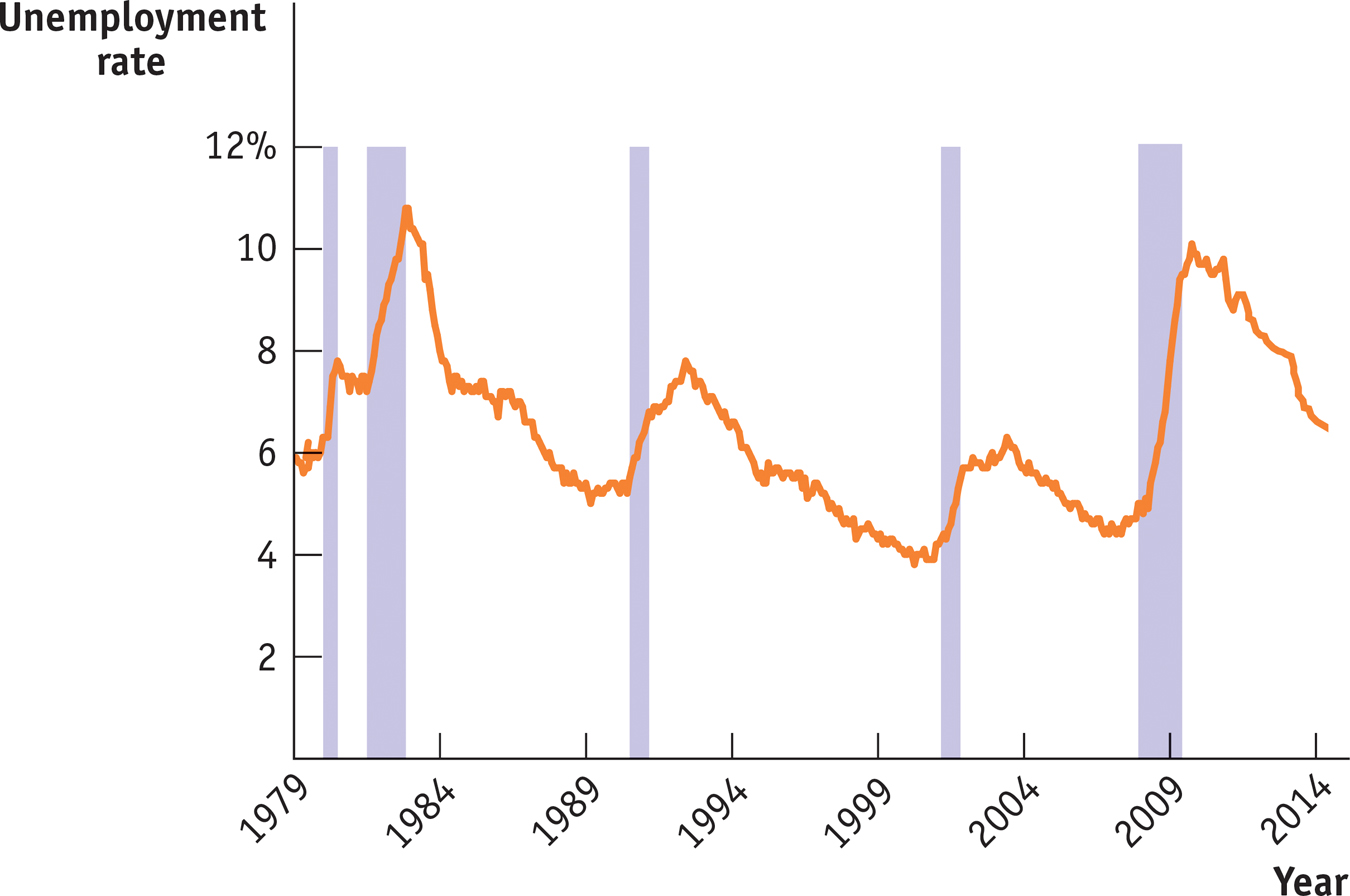
Compared to Figure 8-1, Figure 8-4 shows the U.S. unemployment rate over a somewhat shorter period, the 35 years from 1979 through late 2014. The shaded bars represent periods of recession. As you can see, during every recession, without exception, the unemployment rate rose. The severe recession of 2007–
8-4
Unemployment and Recessions, 1979–

Correspondingly, during periods of economic expansion the unemployment rate usually falls. The long economic expansion of the 1990s eventually brought the unemployment rate to 4.0%, and the expansion of the mid-
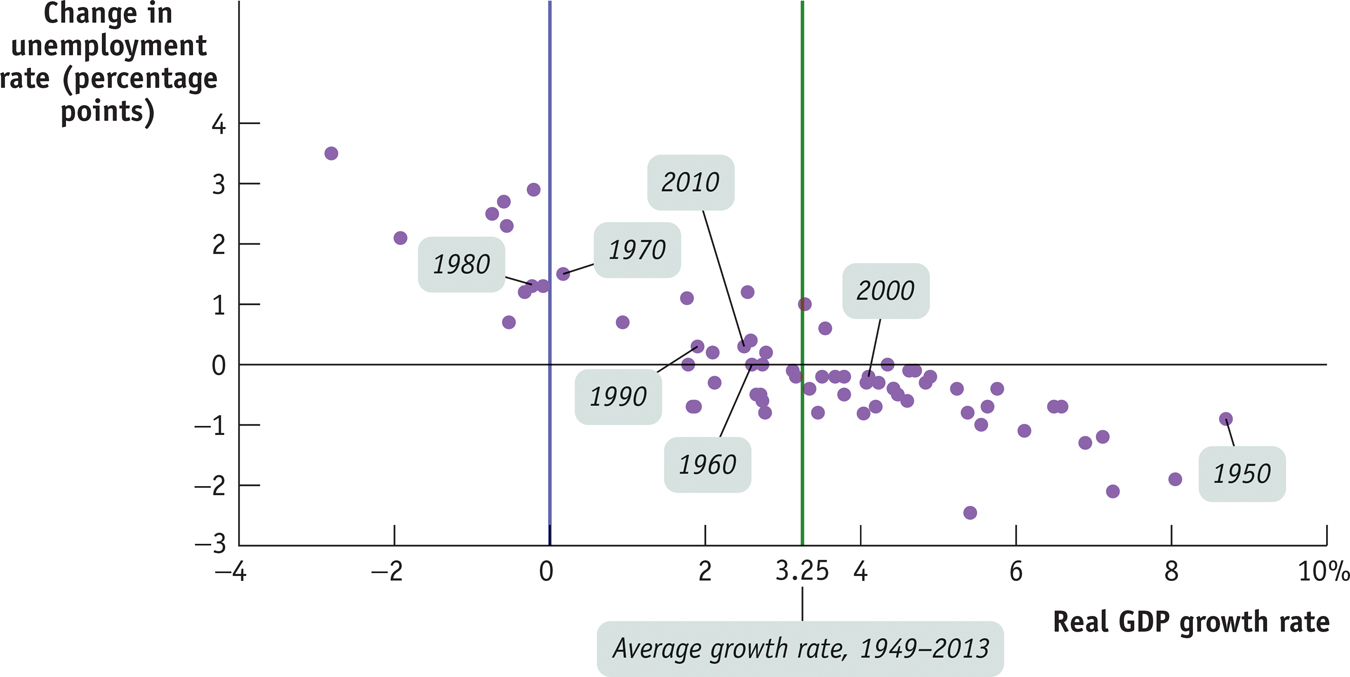
Figure 8-5 is a scatter diagram showing U.S. data for the period from 1949 to 2013. The horizontal axis measures the annual rate of growth in real GDP—
8-5
Growth and Changes in Unemployment, 1949–

The downward trend of the scatter diagram in Figure 8-5 shows that there is a generally strong negative relationship between growth in the economy and the rate of unemployment. Years of high growth in real GDP were also years in which the unemployment rate fell, and years of low or negative growth in real GDP were years in which the unemployment rate rose.
The green vertical line in Figure 8-5 at the value of 3.25% indicates the average growth rate of real GDP over the period from 1949 to 2013. Points lying to the right of the vertical line are years of above-
A jobless recovery is a period in which the real GDP growth rate is positive but the unemployment rate is still rising.
A period in which real GDP is growing at a below-
ECONOMICS in Action: Failure to Launch
Failure to Launch
In March 2010, when the U.S. job situation was near its worst, the Harvard Law Record published a brief note titled “Unemployed law student will work for $160K plus benefits.” In a self-
8-6
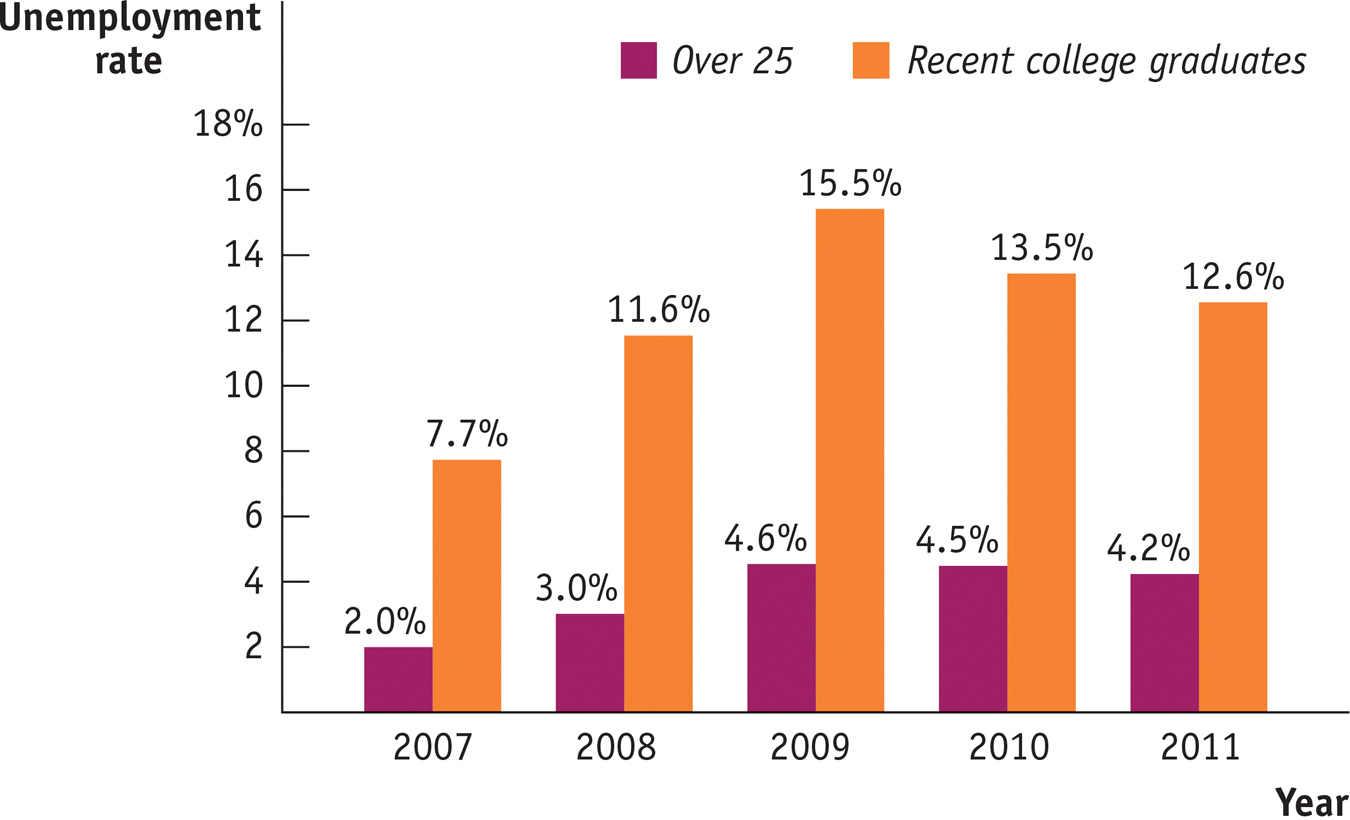
Unemployment Rate for Recent College Graduates, 2007–

The answer, of course, is that it wasn’t about the résumé—it was about the economy. Times of high unemployment are especially hard on new graduates, who often find it hard to get any kind of full-
How bad was it around the time that note was written? Figure 8-6 shows unemployment rates for two kinds of college graduates—
Quick Review
The labor force, equal to employment plus unemployment, does not include discouraged workers. Nor do labor statistics contain data on underemployment. The labor force participation rate is the percentage of the population age 16 and over in the labor force.
The unemployment rate is an indicator of the state of the labor market, not an exact measure of the percentage of workers who can’t find jobs. It can overstate the true level of unemployment because workers often spend time searching for a job even when jobs are plentiful. But it can also understate the true level of unemployment because it excludes discouraged workers, marginally attached workers, and underemployed workers.
There is a strong negative relationship between growth in real GDP and changes in the unemployment rate. When growth is above average, the unemployment rate generally falls. When growth is below average, the unemployment rate generally rises—
a period called a jobless recovery that typically follows a deep recession.
8-1
Question 8.1
Suppose that the advent of employment websites enables job-
seekers to find suitable jobs more quickly. What effect will this have on the unemployment rate over time? Also suppose that these websites encourage job- seekers who had given up their searches to begin looking again. What effect will this have on the unemployment rate? The advent of websites that enable job-seekers to find jobs more quickly will reduce the unemployment rate over time. However, websites that induce discouraged workers to begin actively looking for work again will lead to an increase in the unemployment rate over time.
Question 8.2
In which of the following cases is a worker counted as unemployed? Explain.
Rosa, an older worker who has been laid off and who gave up looking for work months ago
Rosa is not counted as unemployed because she is not actively looking for work, but she is counted in broader measures of labor underutilization as a discouraged worker.
Anthony, a schoolteacher who is not working during his three-
month summer break Anthony is not counted as unemployed; he is considered employed because he has a job.
Grace, an investment banker who has been laid off and is currently searching for another position
Grace is unemployed; she is not working and is actively looking for work.
Sergio, a classically trained musician who can only find work playing for local parties
Sergio is not unemployed, but underemployed; he is working part time for economic reasons. He is counted in broader measures of labor underutilization.
Natasha, a graduate student who went back to school because jobs were scarce
Natasha is not unemployed, but she is a marginally attached worker. She is counted in broader measures of labor underutilization.
Question 8.3
Which of the following are consistent with the observed relationship between growth in real GDP and changes in the unemployment rate as shown in Figure 8-5? Which are not?
A rise in the unemployment rate accompanies a fall in real GDP.
An exceptionally strong business recovery is associated with a greater percentage of the labor force being employed.
Negative real GDP growth is associated with a fall in the unemployment rate.
Both parts a and b are consistent with the relationship, illustrated in Figure 8-5, between above-average or below-average growth in real GDP and changes in the unemployment rate: during years of above-average growth, the unemployment rate falls, and during years of below-average growth, the unemployment rate rises. However, part c is not consistent: it implies that a recession is associated with a fall in the unemployment rate, which is correct.
Solutions appear at back of book.