7Price Controls and Quantity Controls
WHAT YOU WILL LEARN
 The meaning of price controls and quantity controls, two ways government intervenes in markets
 How price controls can create problems and make a market inefficient
 Who benefits and who loses from price controls, and why they are used despite their well-
known problems  How quantity controls can create problems and make a market inefficient
Why Governments Control Prices and Quantities
You learned in Module 6 that a market moves to equilibrium—
Price controls are legal restrictions on how high or low a market price may go.
Price controls can take two forms: a price ceiling, a maximum price sellers are allowed to charge for a good or service, or a price floor, a minimum price buyers are required to pay for a good or service.
As a result, there is often a strong political demand for governments to intervene in markets. And powerful interests can make a compelling case that a market intervention favoring them is “fair.” When a government intervenes to regulate prices, we say that it imposes price controls. Price controls typically take the form of either an upper limit, a price ceiling, or a lower limit, a price floor.
A quantity control, or quota, is an upper limit on the quantity of some good that can be bought or sold.
A license gives its owner the right to supply a good or service.
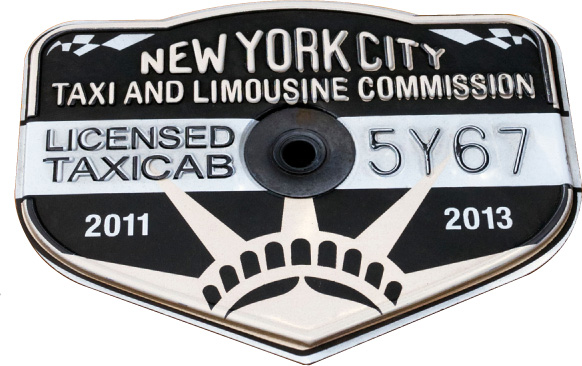
When a government intervenes to regulate quantities, we say that it imposes a quantity control, or quota. Typically the government limits quantity in a market by issuing licenses so that only people with a license can legally supply the good. New York’s taxi medallion is an example of such a license.
Unfortunately, it’s not that easy to tell a market what to do. As we will now see, when a government tries to legislate prices or quantities there are certain predictable and unpleasant side effects.
Price Ceilings
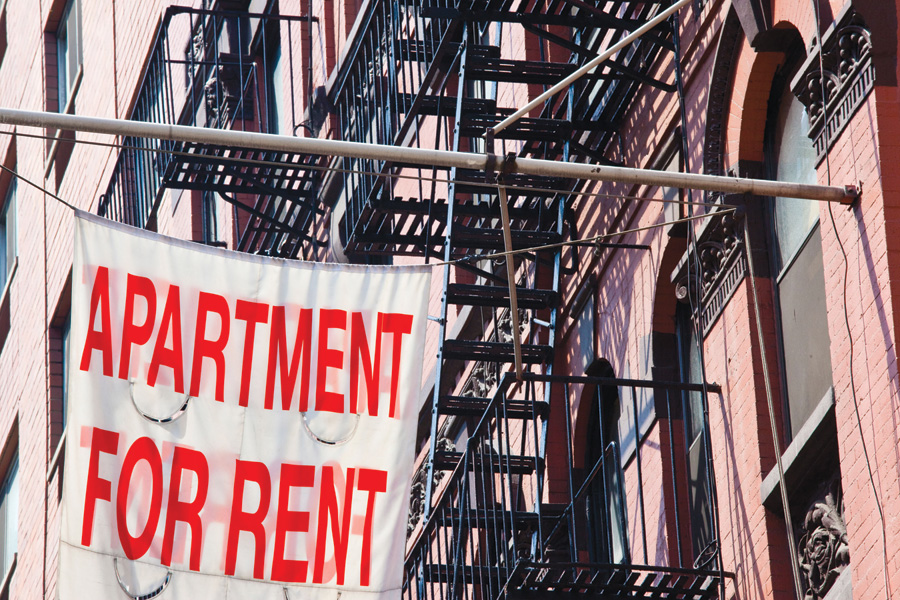
Aside from rent control, a law that prevents landlords from raising rents except when specifically given permission, there are not many price ceilings in the United States today. But at times they have been widespread.
Price ceilings are typically imposed during crises—
Price controls on oil were imposed in 1973, when an embargo by Arab oil-
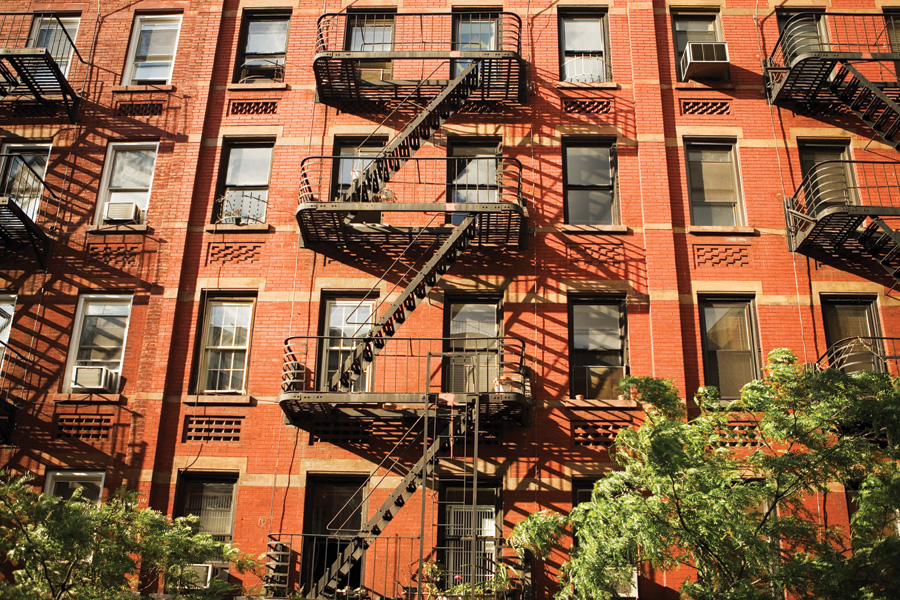
Rent control in New York is, believe it or not, a legacy of World War II: it was imposed because wartime production created an economic boom, which increased demand for apartments at a time when the labor and raw materials that might have been used to build them were being used to win the war instead. Although most price controls were removed soon after the war ended, New York’s rent limits were retained and gradually extended to buildings not previously covered, leading to some very strange situations.
How a Price Ceiling Causes Inefficiency
To see what can go wrong when a government imposes a price ceiling on an efficient market, consider Figure 7-1, which shows a simplified model of the market for apartments in New York. For the sake of simplicity, we imagine that all apartments are exactly the same and so would rent for the same price in an unregulated market.

The table in the figure shows the demand and supply schedules; the demand and supply curves are shown on the left. We show the quantity of apartments on the horizontal axis and the monthly rent per apartment on the vertical axis. You can see that in an unregulated market the equilibrium would be at point E: 2 million apartments would be rented for $1,000 each per month.
Now suppose that the government imposes a price ceiling, limiting rents to a price below the equilibrium price—
Figure 7-2 shows the effect of the price ceiling, represented by the line at $800. At the enforced rental rate of $800, landlords have less incentive to offer apartments, so they won’t be willing to supply as many as they would at the equilibrium rate of $1,000. They will choose point A on the supply curve, offering only 1.8 million apartments for rent, 200,000 fewer than in the unregulated market.

At the same time, more people will want to rent apartments at a price of $800 than at the equilibrium price of $1,000; as shown at point B on the demand curve, at a monthly rent of $800 the quantity of apartments demanded rises to 2.2 million, 200,000 more than in the unregulated market and 400,000 more than are actually available at the price of $800. So there is now a persistent shortage of rental housing: at that price, 400,000 more people want to rent than are able to find apartments.
Do price ceilings always cause shortages? No. If a price ceiling is set above the equilibrium price, it won’t have any effect. Suppose that the equilibrium rental rate on apartments is $1,000 per month and the city government sets a ceiling of $1,200. Who cares? In this case, the price ceiling won’t be binding—
Price ceilings do create inefficiency in at least four distinct ways and can be seriously harmful as a result.
Inefficient Allocation to ConsumersRent control doesn’t just lead to too few apartments being available. It can also lead to misallocation of the apartments that are available: people who badly need a place to live may not be able to find an apartment, while some apartments may be occupied by people with much less urgent needs.
In the case shown in Figure 7-2, 2.2 million people would like to rent an apartment at $800 per month, but only 1.8 million apartments are available. Of those 2.2 million who are seeking an apartment, some want an apartment badly and are willing to pay a high price to get one. Others have a less urgent need and are only willing to pay a low price, perhaps because they have alternative housing.
Price ceilings often lead to inefficiency in the form of inefficient allocation to consumers: people who want the good badly and are willing to pay a high price don’t get it, and those who care relatively little about the good and are only willing to pay a relatively low price do get it.
An efficient allocation of apartments would reflect these differences: people who really want an apartment will get one and people who aren’t all that eager to find an apartment won’t. In an inefficient distribution of apartments, the opposite will happen: some people who are not especially eager to find an apartment will get one and others who are very eager to find an apartment won’t.
Because people usually get apartments through luck or personal connections under rent control, it generally results in an inefficient allocation to consumers of the few apartments available.
Price ceilings typically lead to inefficiency in the form of wasted resources: people expend money, effort, and time to cope with the shortages caused by the price ceiling.
Wasted ResourcesAnother reason a price ceiling causes inefficiency is that it leads to wasted resources: people expend money, effort, and time to cope with the shortages caused by the price ceiling. Back in 1979, U.S. price controls on gasoline led to shortages that forced millions of Americans to spend hours each week waiting in lines at gas stations. The opportunity cost of the time spent in gas lines—
Price ceilings often lead to inefficiency in that the goods being offered are of inefficiently low quality: sellers offer low quality goods at a low price even though buyers would prefer a higher quality at a higher price.
Inefficiently Low QualityYet another way a price ceiling causes inefficiency is by causing goods to be of inefficiently low quality. Inefficiently low quality means that sellers offer low-
Again, consider rent control. Landlords have no incentive to provide better conditions because they cannot raise rents to cover their repair costs but are able to find tenants easily. In many cases, tenants would be willing to pay much more for improved conditions than it would cost for the landlord to provide them—
This whole situation is a missed opportunity—
A black market is a market in which goods or services are bought and sold illegally—
Black MarketsAnd that leads us to a last aspect of price ceilings: the incentive they provide for illegal activities, specifically the emergence of black markets. One type of black market activity is illegal subletting by tenants. But it does not stop there. Clearly, there is a temptation for a landlord to say to a potential tenant, “Look, you can have the place if you slip me an extra few hundred in cash each month”—and for the tenant to agree, if he or she is one of those people who would be willing to pay much more than the maximum legal rent.
What’s wrong with black markets? In general, it’s a bad thing if people break any law, because it encourages disrespect for the law in general. Worse yet, in this case illegal activity worsens the position of those who try to be honest.
So Why Are There Price Ceilings?
Given the unpleasant consequences of price ceilings, why do governments still sometimes impose them?
One answer is that although price ceilings may have adverse effects, they do benefit some people. In practice, New York’s rent-
Also, when price ceilings have been in effect for a long time, buyers may not have a realistic idea of what would happen without them. In our previous example, the rental rate in an unregulated market (Figure 7-1) would be only 25% higher than in the regulated market (Figure 7-2): $1,000 instead of $800. But how would renters know that? Indeed, they might have heard about black market transactions at much higher prices and would not realize that these black market prices are much higher than the price that would prevail in a fully unregulated market.
A last answer is that government officials often do not understand supply and demand analysis! It is a great mistake to suppose that economic policies in the real world are always sensible or well informed.
Price Floors
The minimum wage is a legal floor on the wage rate, which is the market price of labor.
Sometimes governments intervene to push market prices up instead of down. Price floors have been widely legislated for agricultural products, such as wheat and milk, as a way to support the incomes of farmers. Historically, there were also price floors on such services as trucking and air travel, although these were phased out by the U.S. government in the 1970s. If you have ever worked in a fast-
Just like price ceilings, price floors are intended to help some people but generate predictable and undesirable side effects. Figure 7-3 shows hypothetical supply and demand curves for butter. Left to itself, the market would move to equilibrium at point E, with 10 million pounds of butter bought and sold at a price of $1 per pound.

Now suppose that the government, in order to help dairy farmers, imposes a price floor on butter of $1.20 per pound. Its effects are shown in Figure 7-4, where the line at $1.20 represents the price floor. At a price of $1.20 per pound, producers would want to supply 12 million pounds (point B on the supply curve) but consumers would want to buy only 9 million pounds (point A on the demand curve). So the price floor leads to a persistent surplus of 3 million pounds of butter.

Does a price floor always lead to an unwanted surplus? No. Just as in the case of a price ceiling, the floor may not be binding—
But suppose that a price floor is binding: what happens to the unwanted surplus? The answer depends on government policy. In the case of agricultural price floors, governments buy up unwanted surplus. As a result, the U.S. government has at times found itself warehousing thousands of tons of butter, cheese, and other farm products. The government then has to find a way to dispose of these unwanted goods.
When the government is not prepared to purchase the unwanted surplus, a price floor means that would-
PRICE FLOORS AND SCHOOL LUNCHES
When you were in grade school, did your school offer free or very cheap lunches? If so, you were probably a beneficiary of price floors.
Where did all the cheap food come from? During the 1930s, when the U.S. economy was going through the Great Depression, a prolonged economic slump, prices were low and farmers were suffering severely. In an effort to help rural Americans, the U.S. government imposed price floors on a number of agricultural products. The system of agricultural price floors—

The big problem with any attempt to impose a price floor is that it creates a surplus. To some extent the U.S. Department of Agriculture has tried to head off surpluses by taking steps to reduce supply; for example, by paying farmers not to grow crops. As a last resort, however, the U.S. government has been willing to buy up the surplus, taking the excess supply off the market.
But then what? The government can’t just sell the agricultural products: that would depress market prices, forcing the government to buy the stuff right back. So it has to give it away in ways that don’t depress market prices. One way to do this is by giving surplus food, free, to school lunch programs. These gifts are known as “bonus foods.” Along with financial aid, bonus foods allow many school districts to provide free or very cheap lunches to their students. Is this a story with a happy ending?
Not really. Nutritionists, concerned about growing child obesity in the United States, place part of the blame on those bonus foods. Schools get whatever the government has too much of—
As a result, school lunches that make extensive use of bonus foods tend to be very high in fat and calories. So this is a case in which there is such a thing as a free lunch—
How a Price Floor Causes Inefficiency
The persistent surplus that results from a price floor creates missed opportunities—
Inefficiently Low QuantityBecause a price floor raises the price of a good to consumers, it reduces the quantity of that good demanded; because sellers can’t sell more units of a good than buyers are willing to buy, a price floor reduces the quantity of a good bought and sold below the market equilibrium quantity. Notice that this is the same effect as a price ceiling. You might be tempted to think that a price floor and a price ceiling have opposite effects, but both have the effect of reducing the quantity of a good bought and sold.
Price floors lead to inefficient allocation of sales among sellers: those who would be willing to sell the good at the lowest price are not always those who manage to sell it.
Inefficient Allocation of Sales Among SellersLike a price ceiling, a price floor can lead to inefficient allocation—but in this case inefficient allocation of sales among sellers rather than inefficient allocation to consumers.
An episode from the Belgian movie Rosetta, a realistic fictional story, illustrates the problem of inefficient allocation of selling opportunities quite well. Like many European countries, Belgium has a high minimum wage, and jobs for young people are scarce. At one point Rosetta, a young woman who is very eager to work, loses her job at a fast-
Wasted ResourcesAlso like a price ceiling, a price floor generates inefficiency by wasting resources. The most graphic examples involve government purchases of the unwanted surpluses of agricultural products caused by price floors. When the surplus production is simply destroyed, and when the stored produce goes, as officials euphemistically put it, “out of condition” and must be thrown away, it is pure waste.
Price floors also lead to wasted time and effort. Consider the minimum wage. Would-
Inefficiently High QualityAgain like price ceilings, price floors lead to inefficiency in the quality of goods produced.
Price floors often lead to inefficiency in that goods of inefficiently high quality are offered: sellers offer high-
We’ve seen that when there is a price ceiling, suppliers produce goods that are of inefficiently low quality: buyers prefer higher-
How can this be? Isn’t high quality a good thing? Yes, but only if it is worth the cost. Suppose that suppliers spend a lot to make goods of very high quality but that this quality isn’t worth much to consumers, who would rather receive the money spent on that quality in the form of a lower price. This represents a missed opportunity: suppliers and buyers could make a mutually beneficial deal in which buyers got goods of lower quality for a much lower price.
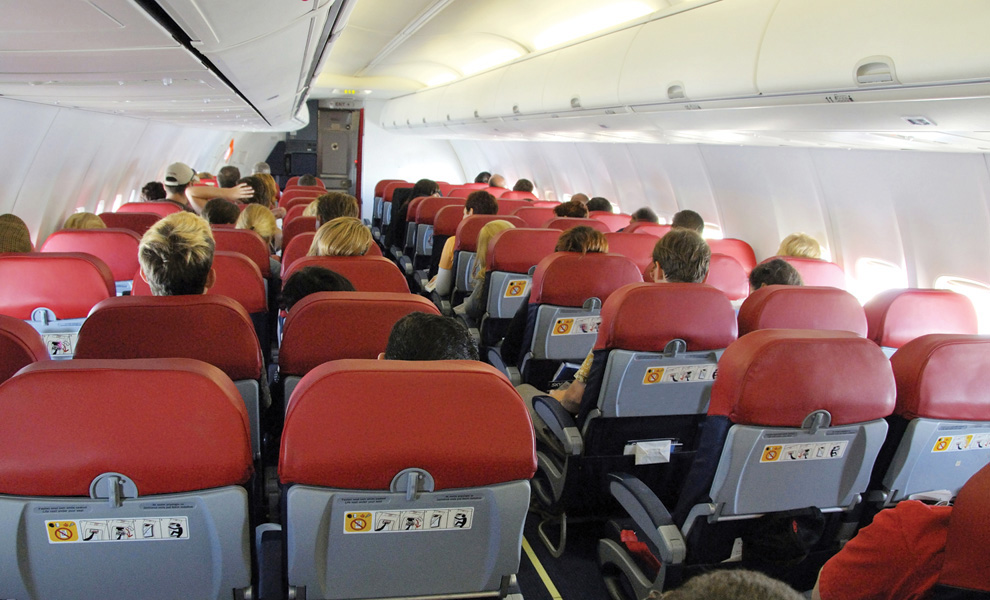
A good example of the inefficiency of excessive quality comes from the days when transatlantic airfares were set artificially high by international treaty. Forbidden to compete for customers by offering lower ticket prices, airlines instead offered expensive services, like lavish in-
Illegal ActivityFinally, like price ceilings, price floors provide incentives for illegal activity. For example, in countries where the minimum wage is far above the equilibrium wage rate, workers desperate for jobs sometimes agree to work off the books for employers who conceal their employment from the government—
So Why Are There Price Floors?
So why do governments impose price floors when they have so many negative side effects? The reasons are similar to those for imposing price ceilings. Government officials often disregard warnings about the consequences of price floors either because they believe that the relevant market is poorly described by the supply and demand model or, more often, because they do not understand the model. Above all, just as price ceilings are often imposed because they benefit some influential buyers of a good, price floors are often imposed because they benefit some influential sellers.
Quantity Controls
In the 1930s, New York City instituted a system of licensing for taxicabs: only taxis with a medallion were allowed to pick up passengers. This licensing system, a form of quantity control also known as a quota, was intended to ensure quality. In the last 60 years the number of medallions has increased by about 16%, to a total of 13,237 medallions, while at the same time the population of New York City has increased by about 60%. The result has been a very high price for a medallion—
To understand why a New York taxi medallion is worth so much money, we consider a simplified version of the market for taxi rides, shown in Figure 7-5. Just as we assumed in the analysis of rent control that all apartments were the same, we now suppose that all taxi rides are the same—

The New York medallion system limits the number of taxis, but each taxi driver can offer as many rides as he or she can manage. (Now you know why New York taxi drivers are so aggressive!) To simplify our analysis, however, we will assume that a medallion system limits the number of taxi rides that can legally be given to 8 million per year.
The demand price of a given quantity is the price at which consumers will demand that quantity.
Until now, we have derived the demand curve by answering questions of the form: “How many taxi rides will passengers want to take if the price is $5 per ride?” But it is possible to reverse the question and ask instead: “At what price will consumers want to buy 10 million rides per year?” The price at which consumers want to buy a given quantity—
The supply price of a given quantity is the price at which producers will supply that quantity.
Similarly, the supply curve represents the answer to questions of the form: “How many taxi rides would taxi drivers supply at a price of $5 each?” But we can also reverse this question to ask: “At what price will producers be willing to supply 10 million rides per year?” The price at which producers will supply a given quantity—
Now we are ready to analyze a quota. We have assumed that the city government limits the quantity of taxi rides to 8 million per year. Medallions, each of which carries the right to provide a certain number of taxi rides per year, are made available to selected people in such a way that a total of 8 million rides will be provided. Medallion-
Figure 7-6 shows the resulting market for taxi rides, with the black vertical line at 8 million rides per year representing the quota. Because the quantity of rides is limited to 8 million, consumers must be at point A on the demand curve, corresponding to the shaded entry in the demand schedule: the demand price of 8 million rides is $6 per ride. Meanwhile, taxi drivers must be at point B on the supply curve, corresponding to the shaded entry in the supply schedule: the supply price of 8 million rides is $4 per ride.

But how can the price received by taxi drivers be $4 when the price paid by taxi riders is $6? The answer is that in addition to the market in taxi rides, there is also a market in medallions. Medallion-
A quantity control, or quota, drives a wedge between the demand price and the supply price of a good; that is, the price paid by buyers ends up being higher than that received by sellers. The difference between the demand and supply price at the quota amount is the quota rent, the earnings that accrue to the license-
It is no coincidence that $2 is exactly the difference between $6, the demand price of 8 million rides, and $4, the supply price of 8 million rides. In every case in which the supply of a good is legally restricted, there is a wedge between the demand price of the quantity transacted and the supply price of the quantity transacted. This wedge, illustrated by the double-
So Figure 7-6 also illustrates the quota rent in the market for New York taxi rides. The quota limits the quantity of rides to 8 million per year, a quantity at which the demand price of $6 exceeds the supply price of $4. The wedge between these two prices, $2, is the quota rent that results from the restrictions placed on the quantity of taxi rides in this market.

So regardless of whether the medallion owner uses the medallion himself or herself, or rents it to others, it is a valuable asset. And this is represented in the going price for a New York City taxi medallion. Notice, by the way, that quotas—
The Costs of Quantity Controls
Like price controls, quantity controls can have some predictable and undesirable side effects. The first is the by-
The same is true for the next 1 million rides: New Yorkers would be willing to pay at least $5 per ride when the quantity of rides is increased from 9 to 10 million, and taxi drivers would be willing to provide those rides as long as they got at least $5 per ride. Again, these rides would have occurred without the quota.
Only when the market has reached the unregulated market equilibrium quantity of 10 million rides are there no “missed-
Deadweight loss is the lost gains associated with transactions that do not occur due to market intervention.
Economists have a special term for the lost gains from missed opportunities such as these: deadweight loss. Generally, when the demand price exceeds the supply price, there is a deadweight loss. Figure 7-6 illustrates the deadweight loss with a shaded triangle between the demand and supply curves. This triangle represents the missed gains from taxi rides prevented by the quota, a loss that is experienced by both disappointed would-
Because there are transactions that people would like to make but are not allowed to, quantity controls generate an incentive to evade them or even to break the law. New York’s taxi industry again provides clear examples. Taxi regulation applies only to those drivers who are hailed by passengers on the street. A car service that makes prearranged pickups does not need a medallion. As a result, such hired cars provide much of the service that might otherwise be provided by taxis, as in other cities.
In addition, there are substantial numbers of unlicensed cabs that simply defy the law by picking up passengers without a medallion. Because these cabs are illegal, their drivers are completely unregulated, and they generate a disproportionately large share of traffic accidents in New York City.
THE CLAMS OF THE JERSEY SHORE

One industry that New Jersey really dominates is clam fishing. The Garden State typically supplies about 70% of the country’s surf clams, whose tongues are used in fried-
In the 1980s, however, excessive fishing threatened to wipe out New Jersey’s clam beds. To save the resource, the U.S. government introduced a clam quota, which sets an overall limit on the number of bushels of clams that may be caught and allocates licenses to owners of fishing boats based on their historical catches.
Notice, by the way, that this is an example of a quota that is probably justified by broader economic and environmental considerations—
7
Solutions appear at the back of the book.
Check Your Understanding
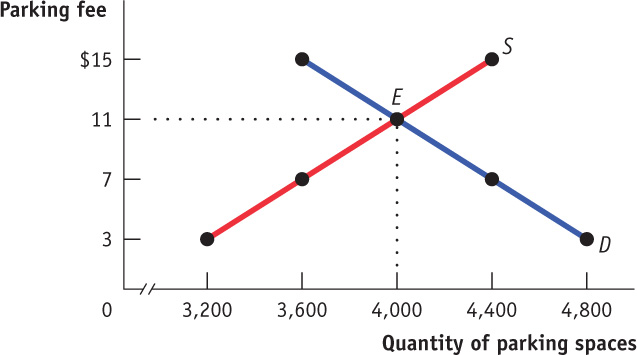
On game days, homeowners near Middletown University’s stadium used to rent parking spaces in their driveways to fans at a going rate of $11. A new town ordinance now sets a maximum parking fee of $7. Use the accompanying supply and demand diagram to explain how each of the following can result from the price ceiling.
-
a. Some homeowners now think it’s not worth the hassle to rent out spaces.
Fewer homeowners are willing to rent out their drive ways because the price ceiling has reduced the payment they receive. This is an example of a fall in price leading to a fall in the quantity supplied. This is shown in the accompanying diagram by the movement from point E to point A along the supply curve, a reduction in quantity of 400 parking spaces. -
b. Some fans who used to carpool to the game now drive alone.
The quantity demanded increases by 400 spaces as the price decreases. At a lower price, more fans are willing to drive and rent a parking space. It is shown in the diagram by the movement from point E to point B along the demand curve. -
c. Some fans can’t find parking and leave without seeing the game.
Under a price ceiling, the quantity demanded exceeds the quantity supplied; as a result, shortages arise. In this case, there will be a shortage of 800 parking spaces. It is shown by the horizontal distance between points A and B.
Explain how each of the following adverse effects arises from the price ceiling.
-
d. Some fans now arrive several hours early to find parking.
Price ceilings result in wasted resources. The additional time fans spend to secure a parking space is wasted time. -
e. Friends of homeowners near the stadium regularly attend games, even if they aren’t big fans. But some serious fans have given up because of the parking situation.
Price ceilings lead to the inefficient allocation of goods—here, the parking spaces—to consumers. If less serious fans with connections end up with the parking spaces, diehard fans have no place to park. -
f. Some homeowners rent spaces for more than $7 but pretend that the buyers are nonpaying friends or family.
Price ceilings lead to black markets.
-
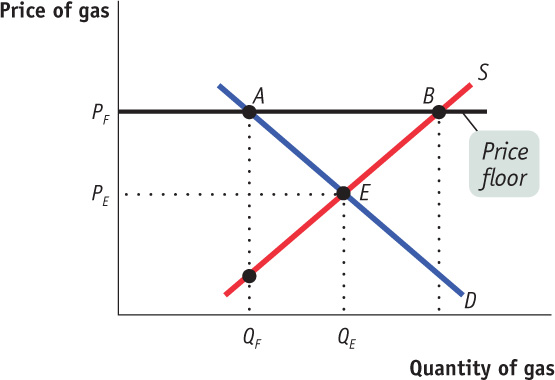
The state legislature mandates a price floor for gasoline of PF per gallon. Assess the following statements and illustrate your answer using the figure provided.
-
a. Proponents of the law claim it will increase the income of gas station owners. Opponents claim it will hurt gas station owners because they will lose customers.
Some gas station owners will benefit from getting a higher price. QF indicates the sales made by these owners. But some will lose; there are those who make sales at the market equilibrium price of PE but do not make sales at the regulated price of PF. These missed sales are indicated on the graph by the fall in the quantity demanded along the demand curve, from point E to point A. -
b. Proponents claim consumers will be better off because gas stations will provide better service. Opponents claim consumers will be generally worse off because they prefer to buy gas at cheaper prices.
Those who buy gas at the higher price of PF will probably receive better service; this is an example of inefficiently high quality caused by a price floor as gas station owners compete on quality rather than price. But opponents are correct to claim that consumers are generally worseoff—those who buy at PF would have been happy to buy at PE, and many who were willing to buy at a price between PE and PF are now unwilling to buy. This is indicated on the graph by the fall in the quantity demanded along the demand curve, from point E to point A. -
c. Proponents claim that they are helping gas station owners without hurting anyone else. Opponents claim that consumers are hurt and will end up doing things like buying gas in a nearby state or on the black market.
Proponents are wrong because consumers and some gas station owners are hurt by the price floor, which creates “missed opportunities”—desirable transactions between consumers and station owners that never take place. Moreover, the inefficiency of wasted resources arises as consumers spend time and money driving to other states. The price floor also tempts people to engage in black market activity. With the price floor, only QF units are sold. But at prices between PE and PF, there are drivers who together want to buy more than QF and owners who are willing to sell to them, a situation likely to lead to illegal activity.
-
Suppose that the supply and demand for taxi rides is given by Figure 7-5 and a quota is set at 6 million rides. Replicate the graph from Figure 7-5, and explain where to find each of the following on your graph:
-
a. the price of a ride
The price of a ride is $7 since the quantity demanded at this price is 6 million: $7 is the demand price of 6 million rides. This is represented by point A in the accompanying figure.
-
b. the quota rent
At 6 million rides, the supply price is $3 per ride, represented by point B in the figure. The wedge between the demand price of $7 per ride and the supply price of $3 per ride is the quota rent per ride, $4. This is represented in the figure above by the vertical distance between points A and B. -
c. the deadweight loss resulting from the quota
The quota discourages 4 million mutually beneficial transactions. The shaded triangle in the figure represents the deadweight loss.
Suppose the quota on taxi rides is increased to 9 million.
-
d. Draw another graph to illustrate what happens to the quota rent and the deadweight loss in this scenario. Explain your findings.
At 9 million rides, the demand price is $5.50 per ride, indicated by point C in the following figure, and the supply price is $4.50 per ride, indicated by point D. The quota rent is the difference between the demand price and the supply price: $1. The deadweight loss is represented by the shaded triangle in the figure. Compare that area to the figure in part a, and you can see that the deadweight loss is smaller when the quota is set at 9 million rides than when it is set at 6 million rides.
-
Multiple-
Question
Refer to the graph provided to determine whether a price ceiling set at $3 will result in:

A. B. C. D. E. Question
Effective price ceilings are inefficient because they
A. B. C. D. E. Question
Refer to the graph provided. If the government establishes a minimum wage at $10, how many workers will benefit from the higher wage?

A. B. C. D. E. Question
Based on the information in the graph provided, if the government established a quota of 1,000 in this market the demand price would be _______ and the supply price would be _______.

A. B. C. D. E. Question
Quotas lead to which of the following?
I. inefficiency due to missed opportunities
II. incentives to evade or break the law
III. a surplus in the marketA. B. C. D. E.
Critical-
Draw separate graphs to illustrate each of the following and explain each graph.
How a price ceiling results in a shortage of the good.
A binding price ceiling sets the maximum price that can be charged at a level below the market equilibrium price. This lower price will reduce quantity supplied and increase quantity demanded, resulting in a shortage.
How a price floor results in a surplus of the good.
A binding price floor sets the minimum price that canbe charged at a level above the market equilibrium price. This higher price will reduce quantity demanded and increase quantity supplied, resulting in a surplus.
How a quantity restriction or quota results in quota rent to the holder of the license.
A binding quantity restriction reduces the quantity of the good that can be sold to a level below the equilibrium quantity. Given quantity is limited, firms can charge a price (PD) that is higher than the price they are willing to sell for (PS). The difference in these two prices results in quota rent, or extra profit, to the sellers of the good.
CEILINGS, FLOORS, AND QUANTITIES
 A price ceiling pushes the price of a good down. A price floor pushes the price of a good up. So it looks like we can assume that the effects of a price floor are the opposite of the effects of a price ceiling. Put another way, if a price ceiling reduces the quantity of a good bought and sold, doesn’t a price floor increase the quantity?
 No, it doesn’t, because both floors and ceilings reduce the quantity bought and sold. Why? When the quantity of a good supplied isn’t equal to the quantity demanded, the actual quantity sold is determined by the “short side” of the market—
To learn more, see pages 63–
