Problems
1.Each month, usually on the first Friday of the month, the Bureau of Labor Statistics releases the Employment Situation Summary for the previous month. Go to www.bls.gov and find the latest report. (On the Bureau of Labor Statistics home page, at the top of the page, select the “Subject” tab, find “Unemployment,” and select “National Unemployment Rate.” You will find the Employment Situation Summary on the middle of the page under “CPS News Releases” by selecting “Employment Situation.”) How does the unemployment rate compare to the rate one month earlier? How does the unemployment rate compare to the rate one year earlier?
2.In general, how do changes in the unemployment rate vary with changes in real GDP? After several quarters of a severe recession, explain why we might observe a decrease in the official unemployment rate. Explain why we could see an increase in the official unemployment rate after several quarters of a strong expansion.
3.In each of the following situations, what type of unemployment is Melanie facing?
After completing a complex programming project, Melanie is laid off. Her prospects for a new job requiring similar skills are good, and she has signed up with a programmer placement service. She has passed up offers for low-
paying jobs. When Melanie and her co-
workers refused to accept pay cuts, her employer outsourced their programming tasks to workers in another country. This phenomenon is occurring throughout the programming industry. Due to the current slump, Melanie has been laid off from her programming job. Her employer promises to rehire her when business picks up.
4.Part of the information released in the Employment Situation Summary concerns how long individuals have been unemployed. Go to www.bls.gov to find the latest report. Use the same technique as in Problem 1 to find the Employment Situation Summary. Near the end of the Employment Situation, click on Table A-
How many workers were unemployed less than 5 weeks? What percentage of all unemployed workers do these workers represent? How do these numbers compare to the previous month’s data?
How many workers were unemployed for 27 or more weeks? What percentage of all unemployed workers do these workers represent? How do these numbers compare to the previous month’s data?
How long has the average worker been unemployed (average duration, in weeks)? How does this compare to the average for the previous month’s data?
Comparing the latest month for which there are data with the previous month, has the problem of long-
term unemployment improved or deteriorated?
5.There is only one labor market in Profunctia. All workers have the same skills, and all firms hire workers with these skills. Use the accompanying diagram, which shows the supply of and demand for labor, to answer the following questions. Illustrate each answer with a diagram.
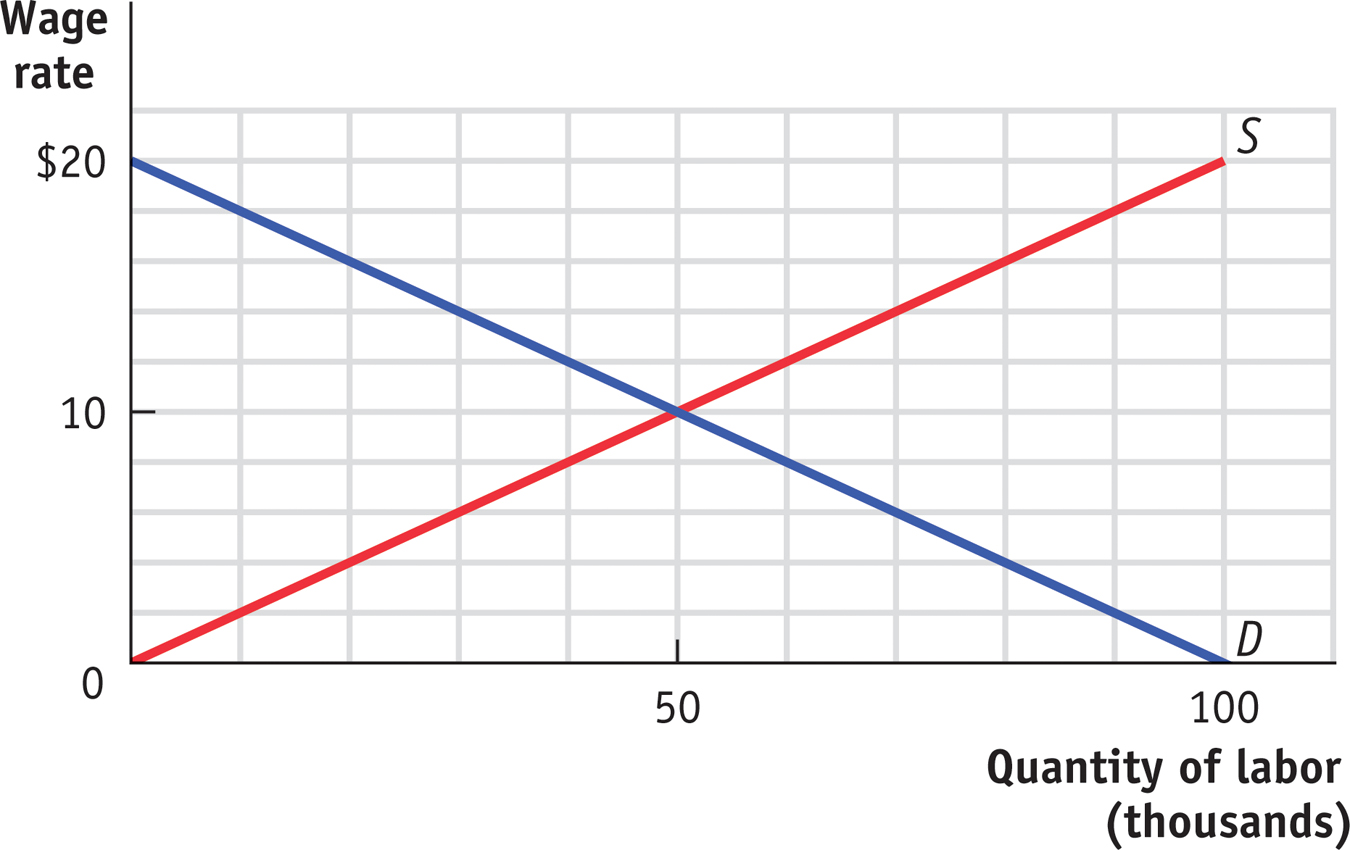
What is the equilibrium wage rate in Profunctia? At this wage rate, what are the level of employment, the size of the labor force, and the unemployment rate?
If the government of Profunctia sets a minimum wage equal to $12, what will be the level of employment, the size of the labor force, and the unemployment rate?
If unions bargain with the firms in Profunctia and set a wage rate equal to $14, what will be the level of employment, the size of the labor force, and the unemployment rate?
If the concern for retaining workers and encouraging high-
quality work leads firms to set a wage rate equal to $16, what will be the level of employment, the size of the labor force, and the unemployment rate?
6.A country’s labor force is the sum of the number of employed and unemployed workers. The accompanying table provides data on the size of the labor force and the number of unemployed workers for different regions of the United States.
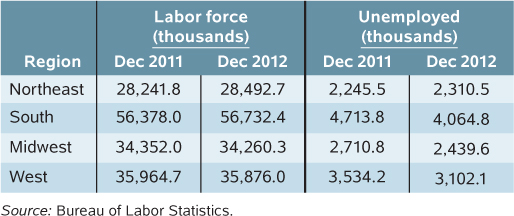
Calculate the number of workers employed in each of the regions in December 2011 and December 2012. Use your answers to calculate the change in the total number of workers employed between December 2011 and December 2012.
For each region, calculate the growth in the labor force from December 2011 and December 2012.
Compute unemployment rates in the different regions of the country in December 2011 and December 2012.
What can you infer about the fall in unemployment rates over this period? Was it caused by a net gain in the number of jobs or by a large fall in the number of people seeking jobs?
7.In which of the following cases is it more likely for efficiency wages to exist? Why?
Jane and her boss work as a team selling ice cream.
Jane sells ice cream without any direct supervision by her boss.
Jane speaks Korean and sells ice cream in a neighborhood in which Korean is the primary language. It is difficult to find another worker who speaks Korean.
8.How will the following changes affect the natural rate of unemployment?
The government reduces the time during which an unemployed worker can receive unemployment benefits.
More teenagers focus on their studies and do not look for jobs until after college.
Greater access to the Internet leads both potential employers and potential employees to use the Internet to list and find jobs.
Union membership declines.
9.With its tradition of a job for life for most citizens, Japan once had a much lower unemployment rate than that of the United States; from 1960 to 1995, the unemployment rate in Japan exceeded 3% only once. However, since the crash of its stock market in 1989 and slow economic growth in the 1990s, the job-
Explain the likely effect of the breakdown of the job-
for- life system in Japan on the Japanese natural rate of unemployment. As the accompanying diagram shows, the rate of growth of real GDP picked up in Japan after 2001 and before the global economic crisis of 2007–
2009. Explain the likely effect of this increase in real GDP growth on the unemployment rate. Was the likely cause of the change in the unemployment rate during this period a change in the natural rate of unemployment or a change in the cyclical unemployment rate? 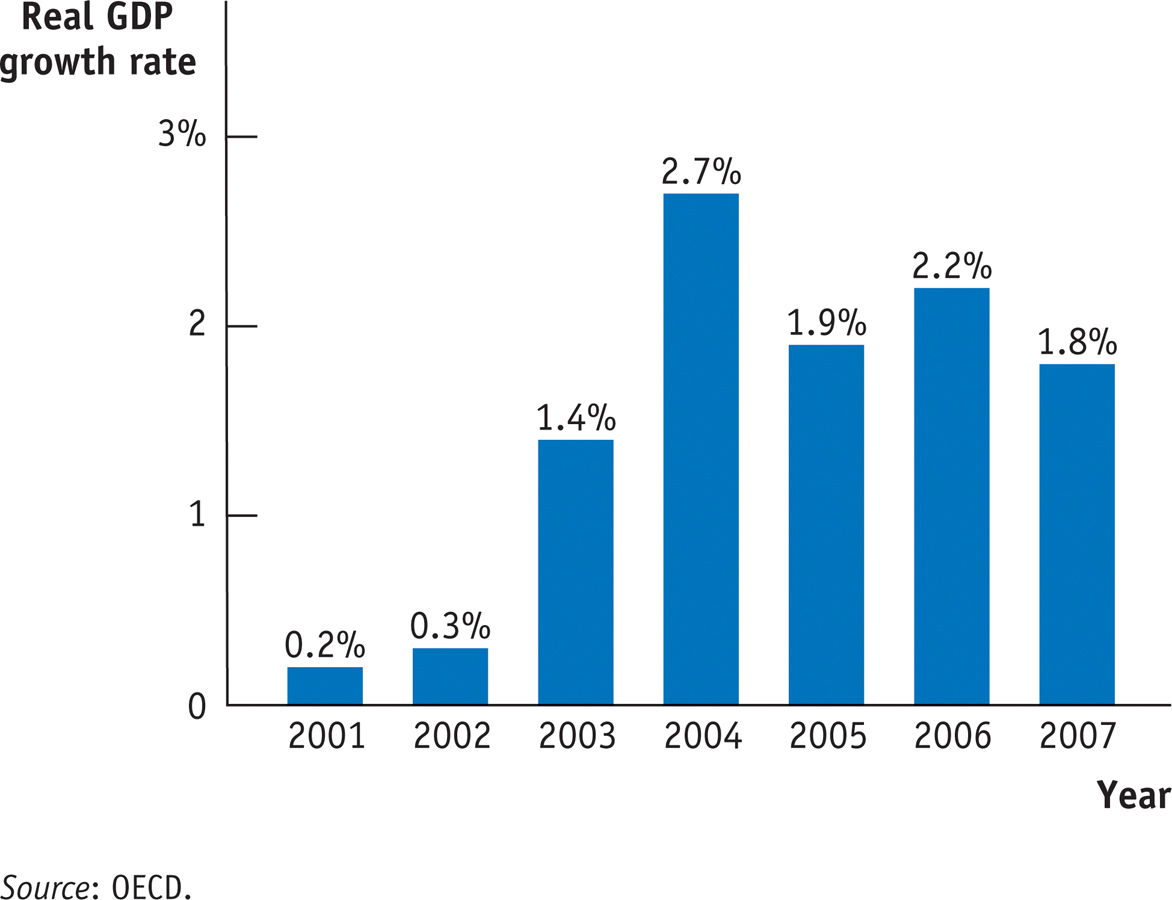
10.In the following examples, is inflation creating winners and losers at no net cost to the economy or is inflation imposing a net cost on the economy? If a net cost is being imposed, which type of cost is involved?
When inflation is expected to be high, workers get paid more frequently and make more trips to the bank.
Lanwei is reimbursed by her company for her work-
related travel expenses. Sometimes, however, the company takes a long time to reimburse her. So when inflation is high, she is less willing to travel for her job. Hector Homeowner has a mortgage with a fixed nominal 6% interest rate that he took out five years ago. Over the years, the inflation rate has crept up unexpectedly to its present level of 7%.
In response to unexpectedly high inflation, the manager of Cozy Cottages of Cape Cod must reprint and resend expensive color brochures correcting the price of rentals this season.
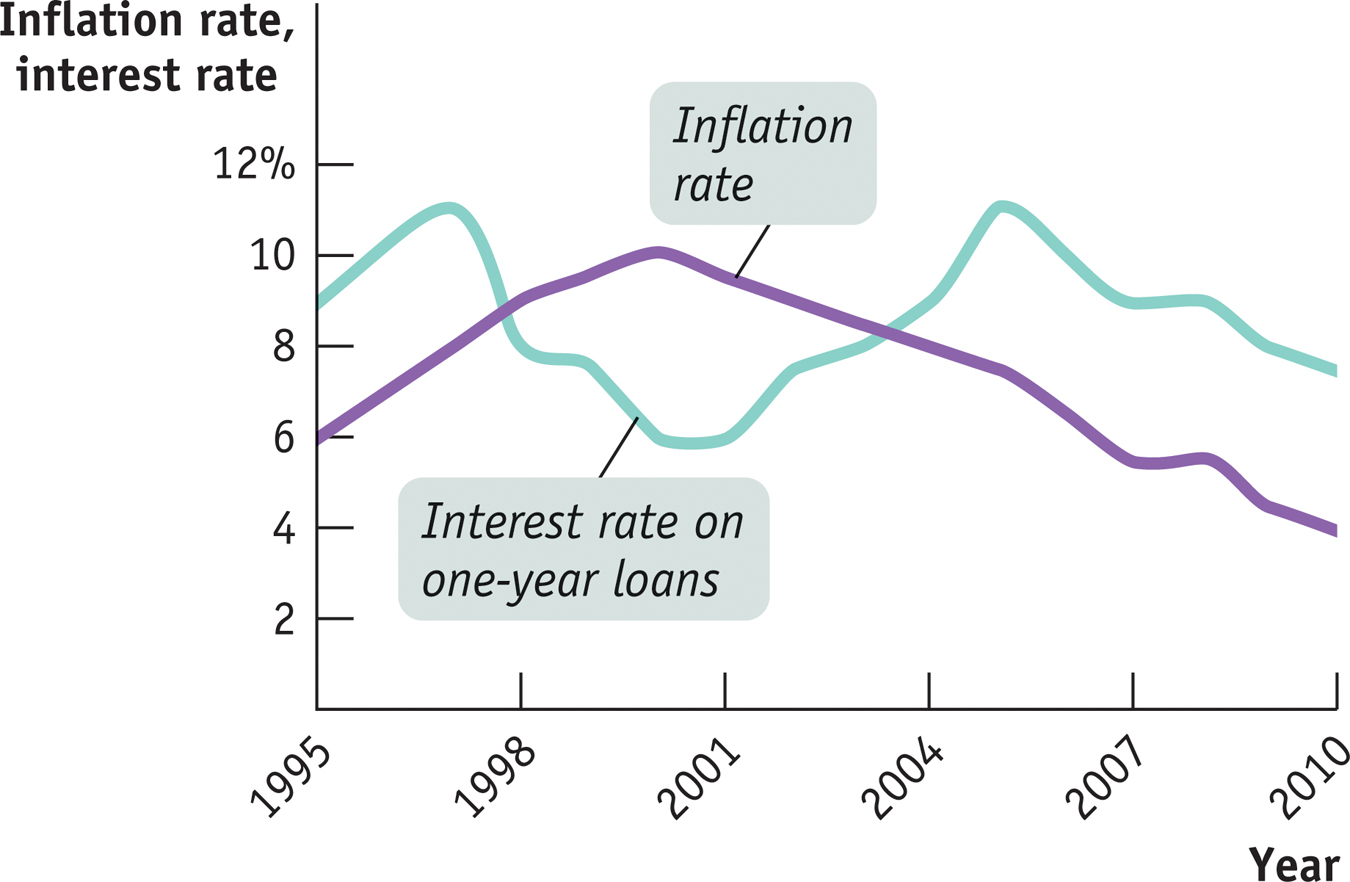
11.The accompanying diagram shows the interest rate on one-
12.The accompanying table provides the inflation rate in the year 2000 and the average inflation rate over the period 2001–
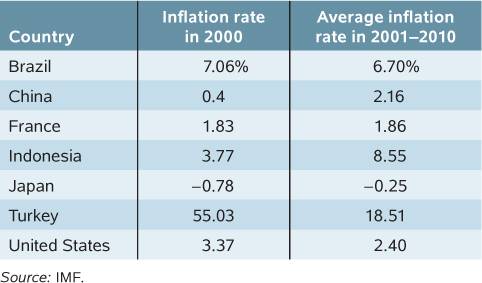
Given the expected relationship between average inflation and menu costs, rank the countries in descending order of menu costs using average inflation over the period 2001–
2010. Rank the countries in order of inflation rates that most favored borrowers with ten-
year loans that were taken out in 2000. Assume that the loans were agreed upon with the expectation that the inflation rate for 2001 to 2010 would be the same as the inflation rate in 2000. Did borrowers who took out ten-
year loans in Japan gain or lose overall versus lenders? Explain.
13.The accompanying diagram shows the inflation rate in the United Kingdom from 1980 to 2010.
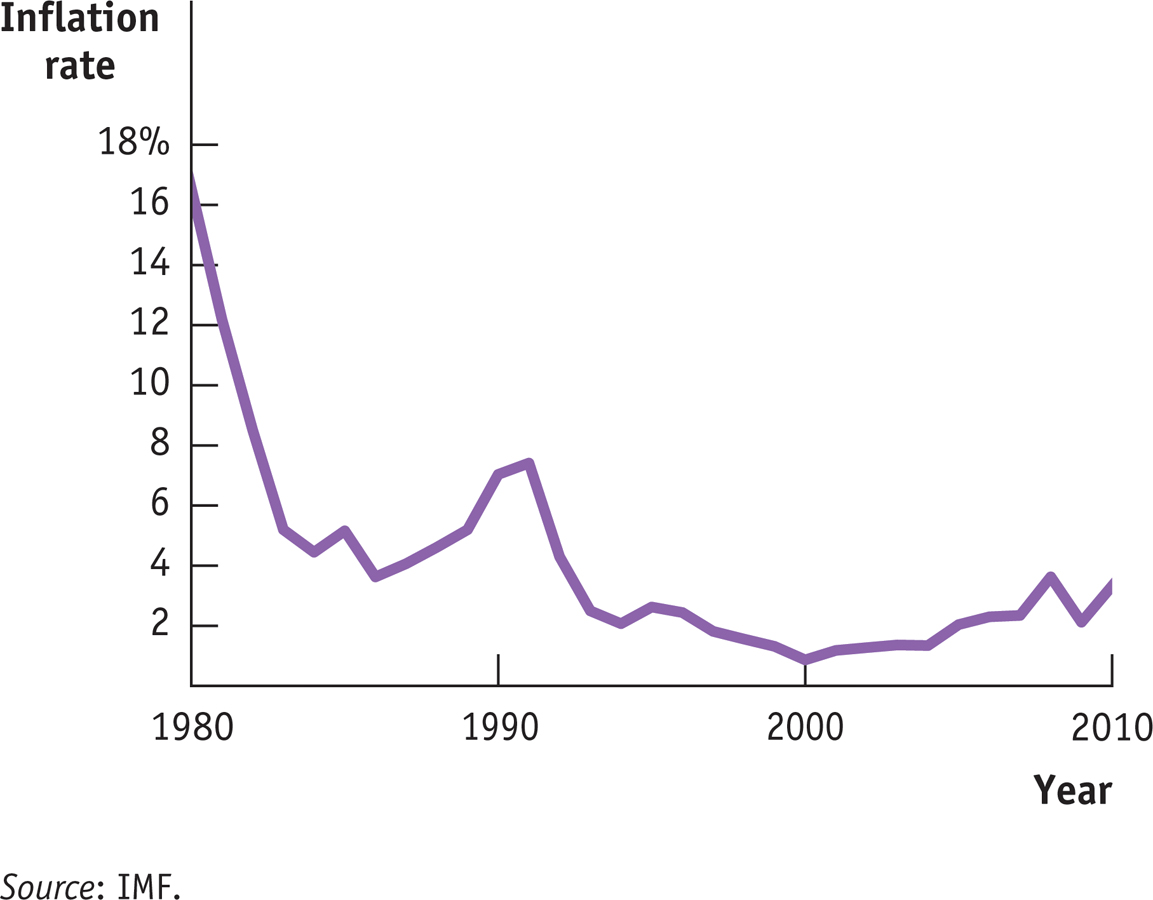
Between 1980 and 1985, policy makers in the United Kingdom worked to lower the inflation rate. What would you predict happened to unemployment between 1980 and 1985?
Policy makers in the United Kingdom react forcefully when the inflation rate rises above a target rate of 2%. Why would it be harmful if inflation rose from 3.4% (the level in 2010) to, say, a level of 5%?
14.Eastland College is concerned about the rising price of textbooks that students must purchase. To better identify the increase in the price of textbooks, the dean asks you, the Economics Department’s star student, to create an index of textbook prices. The average student purchases three English, two math, and four economics textbooks per year. The prices of these books are given in the accompanying table.
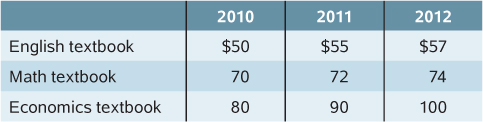
What is the percent change in the price of an English textbook from 2010 to 2012?
What is the percent change in the price of a math textbook from 2010 to 2012?
What is the percent change in the price of an economics textbook from 2010 to 2012?
Using 2010 as a base year, create a price index for these books for all years.
What is the percent change in the price index from 2010 to 2012?
15.The consumer price index, or CPI, measures the cost of living for a typical urban household by multiplying the price for each category of expenditure (housing, food, and so on) times a measure of the importance of that expenditure in the average consumer’s market basket and summing over all categories. However, using data from the consumer price index, we can see that changes in the cost of living for different types of consumers can vary a great deal. Let’s compare the cost of living for a hypothetical retired person and a hypothetical college student. Let’s assume that the market basket of a retired person is allocated in the following way: 10% on housing, 15% on food, 5% on transportation, 60% on medical care, 0% on education, and 10% on recreation. The college student’s market basket is allocated as follows: 5% on housing, 15% on food, 20% on transportation, 0% on medical care, 40% on education, and 20% on recreation. The accompanying table shows the December 2012 CPI for each of the relevant categories.
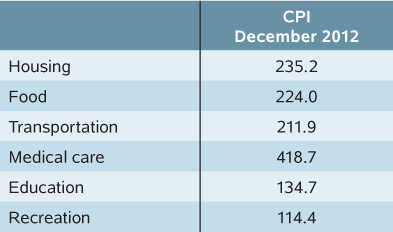
Calculate the overall CPI for the retired person and for the college student by multiplying the CPI for each of the categories by the relative importance of that category to the individual and then summing each of the categories. The CPI for all items in December 2012 was 229.6. How do your calculations for a CPI for the retired person and the college student compare to the overall CPI?
16.Each month the Bureau of Labor Statistics releases the Consumer Price Index Summary for the previous month. Go to the Bureau of Labor Statistics home page at www.bls.gov. Place the cursor over the “Data Tools” tab and then click on “Top Picks.” On that page, scroll down to “Price Indexes” and select the “CPI for all urban consumers,” for base year 1982–
17.The accompanying table provides the annual real GDP (in billions of 2005 dollars) and nominal GDP (in billions of dollars) for the United States.
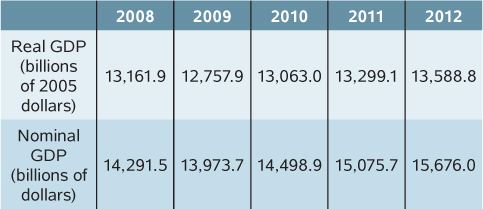
Calculate the GDP deflator for each year.
Use the GDP deflator to calculate the inflation rate for all years except 2008.
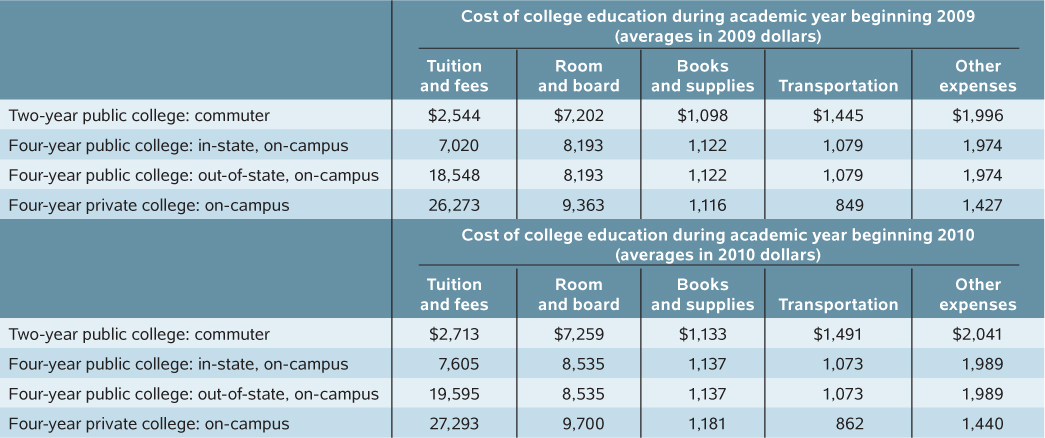
18.The cost of a college education in the United States is rising at a rate faster than inflation. The following table shows the average cost of a college education in the United States during the academic year that began in 2009 and the academic year that began in 2010 for public and private colleges. Assume the costs listed in the table are the only costs experienced by the various college students in a single year.
Calculate the cost of living for an average college student in each category for 2009 and 2010.
Calculate an inflation rate for each type of college student between 2009 and 2010.