1.1 Module 20: Savings and Investment Spending

WHAT YOU WILL LEARN
 Why the savings–
investment spending identity is true  The relationship between savings and investment
Matching Up Savings and Investment Spending
We learned in the previous section that two of the essential ingredients in economic growth are increases in the economy’s levels of human capital and physical capital. Human capital is largely provided by governments through public education. But physical capital, with the exception of infrastructure, is mainly created through private investment spending—
Who pays for private investment spending? In some cases it’s the people or corporations that actually do the spending—
To understand how investment spending is financed, we need to look first at how savings and investment spending are related for the economy as a whole.
The Savings–Investment Spending Identity
According to the savings–
The most basic point to understand about savings and investment spending is that they are always equal. This is not a theory; it’s a fact of accounting called the savings–
To see why the savings–
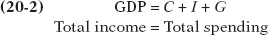
(20-
where C is spending by consumers, I is investment spending, G is government purchases of goods and services, X is the value of exports to other countries, and IM is spending on imports from other countries.
The Savings–
Recall that one person’s spending is another person’s income: the only way people can earn income is by selling something to someone else, and every dollar spent in the economy creates income for somebody. This is represented by Equation 20-
Now, what can be done with income? It can either be spent on consumption—

where S is savings. Meanwhile, as Equation 20-

Putting Equations 20-
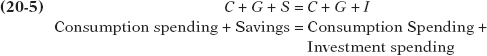
Subtract consumption spending (C + G) from both sides, and we get:
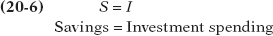
As we said, then, it’s a basic accounting fact that savings equals investment spending for the economy as a whole.
The budget surplus is the difference between tax revenue and government spending when tax revenue exceeds government spending.
Now, let’s take a closer look at savings. Households are not the only parties that can save in an economy. In any given year, the government can save, too, if it collects more tax revenue than it spends. When this occurs, the difference is called a budget surplus and is equivalent to savings by the government.
The budget deficit is the difference between tax revenue and government spending when government spending exceeds tax revenue.
If, alternatively, government spending exceeds tax revenue, there is a budget deficit—a negative budget surplus. In this case, we often say that the government is “dis-
The budget balance is the difference between tax revenue and government spending.
We’ll define the term budget balance to refer to both cases, with the understanding that the budget balance can be positive (a budget surplus) or negative (a budget deficit). The budget balance is defined as:
(20-
National savings, the sum of private savings and the budget balance, is the total amount of savings generated within the economy.
Where T is the value of tax revenues and TR is the value of government transfers. The budget balance is equivalent to savings by government—
(20-
So Equations 20-

The Savings–
So any given country can receive inflows of funds—
Net capital inflow is the total inflow of funds into a country minus the total outflow of funds out of a country.
The net effect of international inflows and outflows of funds on the total savings available for investment spending in any given country is known as the net capital inflow into that country, equal to the total inflow of foreign funds minus the total outflow of domestic funds to other countries. Like the budget balance, a net capital inflow can be negative—
In recent years, the United States has experienced a consistent positive net capital inflow from foreigners, who view our economy as an attractive place to put their savings. In 2012, for example, net capital inflows into the United States were $432 billion.
It’s important to note that, from a national perspective, a dollar generated by national savings and a dollar generated by capital inflow are not equivalent. Yes, they can both finance the same dollar’s worth of investment spending. But any dollar borrowed from a saver must eventually be repaid with interest.

A dollar that comes from national savings is repaid with interest to someone domestically—
The fact that a net capital inflow represents funds borrowed from foreigners is an important aspect of the savings–
Similarly, a country that spends more on imports than it earns from exports must borrow the difference from foreigners. And that difference, the amount of funds borrowed from foreigners, is the country’s net capital inflow. This means that the net capital inflow into a country is equal to the difference between imports and exports:

Re-
(20-
Using Equations 20-

So the application of the savings–
In the United States in 2012, investment spending totaled $2,475 billion. Private savings totaled $3,015 billion, offset by a government budget deficit of $1,087 billion and supplemented by a net capital inflow of $432 billion. Notice that these numbers don’t quite add up; because data collection isn’t perfect, there is a “statistical discrepancy” of $115 billion. But we know that this is an error in the data, not in the theory, because the savings–
It’s also worth noting that 2012 was not a normal year. As we have pointed out previously, in 2008 the U.S. economy (along with the economies of many other nations) was struck by a severe financial crisis. This crisis led both to a plunge in investment spending and to large government budget deficits, effects that have continued. By using data from 2007, the last year before the crisis, we get a much better picture of what savings and investment look like in more normal times.
Figure 20-1 shows what the savings–

In each panel the orange bars on the left show total investment spending and the multicolored bars on the right show the components of savings. U.S. investment spending was 18.8% of GDP, financed by a combination of private savings (15.7% of GDP) and positive net capital inflow or capital inflow (5.2% of GDP) and partly offset by a government budget deficit (–1.6% of GDP). (These numbers sum to more than 18.8% due to statistical discrepancy.)
Japanese investment spending was higher as a percentage of GDP, at 23.8%. It was financed by a higher level of private savings as a percentage of GDP (32.1%) and was offset by both a negative net capital inflow or capital outflow (–4.9% of GDP) and a budget deficit (–3.4% of GDP).
The economy’s savings finance its investment spending. But how are these funds that are available for investment spending allocated among various projects? That is, what determines which projects get financed (such as Facebook’s server farms) and which don’t? We’ll see shortly that funds get allocated to investment spending projects using a familiar method: by the market, via supply and demand.
!world_eia!AMERICA’S LOW SAVINGS
Figure 20-2 shows national savings as a percentage of GDP for seven wealthy economies in 2007. (Again, we focus on 2007 as the last pre-

Note: IMF data differ slightly from other data sources.
In this respect, 2007 wasn’t unusual. The United States has had consistently low national savings compared with other wealthy countries since the 1980s. The main source of these international differences in national savings lies in low U.S. private savings rather than in large U.S. government budget deficits.
Why do Americans save so little? The short answer is that economists aren’t sure, although there are a number of theories. One is that consumers have easier access to credit in the United States than elsewhere. For example, Japanese lenders have traditionally demanded large down payments from home-
It’s also argued that the U.S. Social Security system, by providing guaranteed income in retirement, may reduce the incentive for private saving. In any case, the United States has been able to maintain high levels of investment spending in spite of its low savings rate because it receives large positive net capital inflows.
Module 20 Review
Solutions appear at the back of the book.
Check Your Understanding
Explain whether each of the following statements is true or false for an open economy.
-
a. If the budget balance has a value of zero, then private savings must be equal to investment spending.
-
b. If net capital inflow is positive, then national savings must be less than investment spending.
-
Given the values in the table, find the values for investment spending, national savings, tax revenues, net capital inflow, and private savings.
Multiple-
Question
7MHqob/OQMuG/3S6DQavMYoLBAxlfJQCbEVciGVaNW2ewYgbMkmg7RfJLUuL4qxVF2VMmPn2S5MZ1kWzexwvHLlXik2//4HUq5xzqGJhv82tkzwyTylYDKy+GBLciwAZUtTVFEtY5lmnDeuYPACVEPiLo/sZavOy8xvoeVg44xIccmJpjmbW4J4SANjOEIKwETwmNsAKfEcayQngUWi4wra+wNqDk8vRAo/L6x7wDyRZFzghkubP2a0qFrM1oj2p+ZyHGNVbVHWKGivcaOkCgQ==Question
9HyjveB817bN2UubRPWr0o+lkDKVcSNnZRsj7gb4+yhyL2Lyrepbvyw1SmFd+mUuOKEweiJ5naEsl92nAcVSMyHgLdxyCLmTt6aMcPR0gb8XZ4qIZgZN7l1Y8uftkGNWRDLgxVo8F/D2P0GM5bpOTgQ5OBtck075QqiEnBrDP45LIiCtpHvoEioAagBOkB7JNYQdR4+1DnZD/VvMRgz8Oj7tjKPXAUddljFuSogXI0h/o29EaOPz/XCg7n3dUci8A6p+a6bmYM5+Bdk6ZcsCMgLxsLcjSpZBz1bx9HFYrz0Yidnl529CAUPxqC1VEL8JC2emXn7gQPKR0Yxkgf5KpYKdc8DKYtsLXaKbr7aNNJ5g9FpZQuestion
JWy3AcA+OP179ssAB5zkV/H2EHaYEsqc++BY/F4UoB+JouaRfzPmMhoy0l9Q+ugcOMmoy0Jxw61GZp7MPOPZC1i9mDueN7+DAmOpIvNf8BGgufuZr+zR4I+XBoFTJ38oghF+ymw1cHZ8ntDtwJcDCzz/0iv5v79A7kO9xHSez7m55/thHB2a5oyLaVFPn7iqEmefDto/VjbydQXftmnkixRQrmiVLw1/zlv3WCZbcnbRhw0jC4Ot/PS5BYbU2mLTYDr8vXSPvnNUTQUKLTYwnMUOLOPqBqq8o3Vy33KPY6EsZemNHUj/Fls0GEe77UltrqF00jA5R4L1NorQNkAEpQ8gxtNu7FSBJa6DOq2kNGBYRE6+ApPibVSnKHs9civdPmmjJePyhJg9rbq8Rpj4SPCc6vEhTdZh2ohT9K+sr7I=Question
sjMCWURJdJxiSqkAsnVZo5NtE59OZty8kFaN8WT0fY68D0ccHcIjXwRVAd1KPUS9E+GCW66Txdn2zXIWg68Z/n+H0zAtW4gGGBQgqLjV/0KEGQNvGBJn5dWAAzcoc+QFSAZ0k1vuloFkpAZGskOETtEGPUrm6Uw4pKVNxFTGIA1ZyXT2yvCW4H4QfoopRjp4xswLUgnHJe37okI8ZN9BqX5jm50v+mOu7VyUjCvInhYhcGuYFigTUZAlZttMPreIU+7K6f8f0speO2lwIl2fhn9QNdhgdIerjXxQ69HY4k86GQrC37TPG4EdDjzAkps3idWPD1yZwWVcc1t/Question
fbrY6jgqSha/d4HiT3IExOdXksYOITSBDp15lX5U5Srdays3DqaPsfZTdWHU3D6jL0XcN2GiAeNouLJA8r3fe6MmN+SwifJsfE9FmNWnoTf2v1euPMEZuGDI+sPEpR68hjOekwQw7UCsetDToj6ISfwDqLAP/nYYGMwsrJNQNfIQE9wwJs2rPSEy3tnwfAbC7Us8jZGeOsAy0DmOzOrniJhn6dfotqAiQitQW+oGdFIhY9vjXGi/uLLvI2xB1MuS4cstjH8wL7bO2dX5WfolyWJ0AVHQVid7z8vnm+YUNAFrZcjZtXq75MINRTJK+JHI0wRIVxJrErSJnl7aViiagrmg7lrSJ4HU4H/n4nC8A7W9CaAoidIUZRos3D8=
Critical-
Question 1.1
Identify and describe the relationship between national savings, investment spending, and net capital inflow in an open economy.
PITFALLS: INVESTMENT VS. INVESTMENT SPENDING
INVESTMENT VS. INVESTMENT SPENDING
 What is the difference between investment and investment spending?
 WHEN ECONOMISTS USE THE TERM INVESTMENT SPENDING THEY ALMOST ALWAYS MEAN “SPENDING ON NEW PHYSICAL CAPITAL.” This can be confusing, because in ordinary life we often say that someone who buys stocks or purchases an existing building is “investing.” The important point to keep in mind is that only spending that adds to the economy’s stock of physical capital is “investment spending.” In contrast, the act of purchasing an asset such as a share of stock, a bond, or existing real estate is “making an investment.”
To learn more, see pages 206–
