1.3 32Budget Deficits and Public Debt

WHAT YOU WILL LEARN
 Why governments calculate the cyclically adjusted budget balance
 Why a large public debt may be a cause for concern
 Why implicit liabilities of the government can also be a cause for concern
Headlines about the government’s budget tend to focus on just one point: whether the government is running a surplus or a deficit and, in either case, how big. People usually think of surpluses as good: when the federal government ran a record surplus in 2000, many people regarded it as a cause for celebration. Conversely, people usually think of deficits as bad: the record deficits run by the U.S. federal government from 2009–
The Budget Balance
How do surpluses and deficits fit into the analysis of fiscal policy? Are deficits ever a good thing and surpluses a bad thing? To answer those questions, let’s look at the causes and consequences of surpluses and deficits.
The Budget Balance as a Measure of Fiscal Policy
What do we mean by surpluses and deficits? The budget balance, which we defined earlier, is the difference between the government’s revenue, in the form of tax revenue, and its spending, both on goods and services and on government transfers, in a given year. That is, the budget balance—
(32-
where T is the value of tax revenues, G is government purchases of goods and services, and TR is the value of government transfers. A budget surplus is a positive budget balance and a budget deficit is a negative budget balance.
Other things equal, expansionary fiscal policies—
You might think this means that changes in the budget balance can be used to measure fiscal policy. In fact, economists often do just that: they use changes in the budget balance as a “quick-
- Two different changes in fiscal policy that have equal-
sized effects on the budget balance may have quite unequal effects on the economy. As we have already seen, changes in government purchases of goods and services have a larger effect on real GDP than equal- sized changes in taxes and government transfers. - Often, changes in the budget balance are themselves the result, not the cause, of fluctuations in the economy.
To understand the second point, we need to examine the effects of the business cycle on the budget.
The Business Cycle and the Cyclically Adjusted Budget Balance
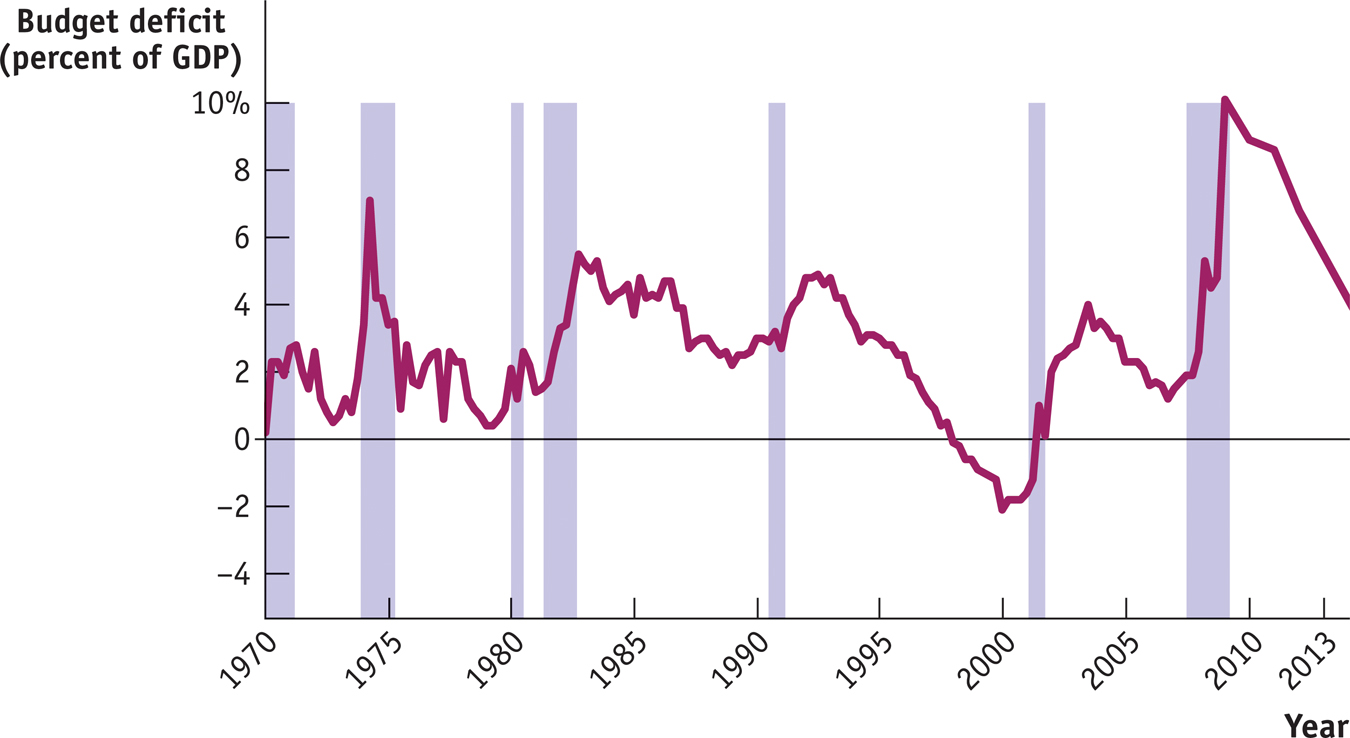
Historically there has been a strong relationship between the federal government’s budget balance and the business cycle. The budget tends to move into deficit when the economy experiences a recession, but deficits tend to get smaller or even turn into surpluses when the economy is expanding. Figure 32-1 shows the federal budget deficit as a percentage of GDP from 1970 to 2013. Shaded areas indicate recessions; unshaded areas indicate expansions. As you can see, the federal budget deficit increased around the time of each recession and usually declined during expansions. In fact, in the late stages of the long expansion from 1991 to 2000, the deficit actually became negative—
Sources: Bureau of Economic Analysis; National Bureau of Economic Research.
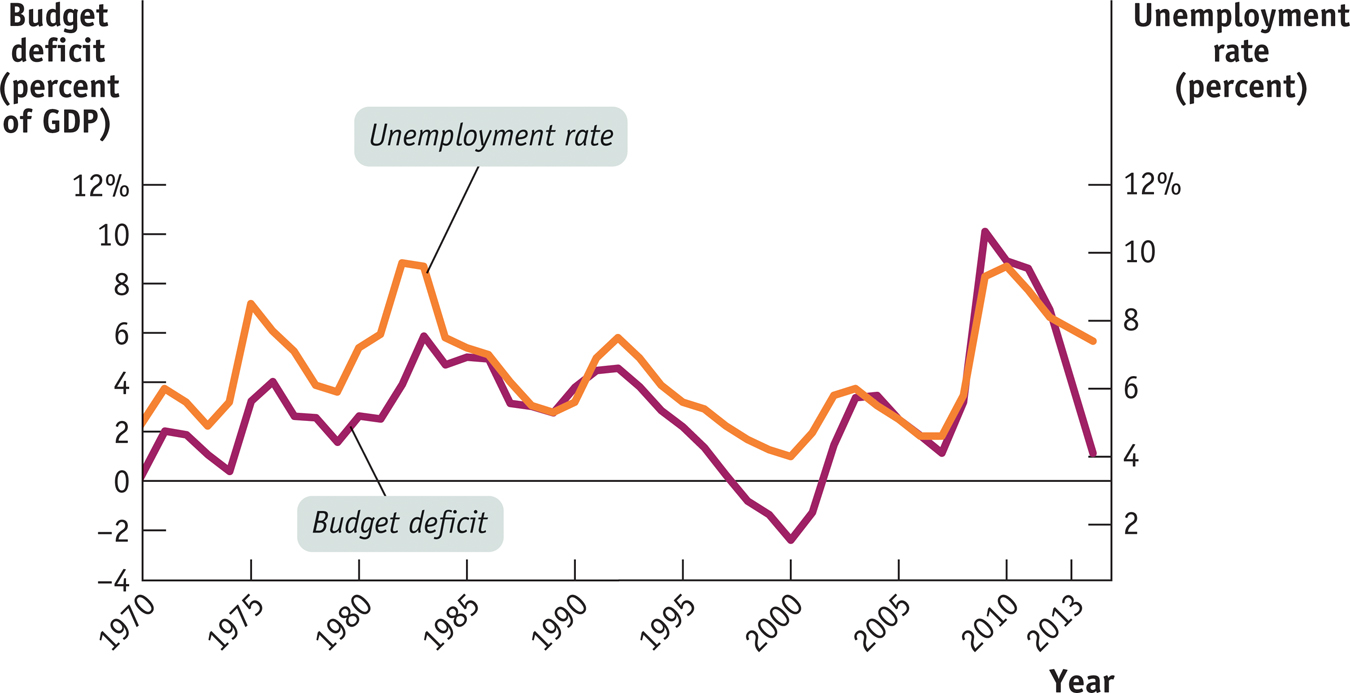
The relationship between the business cycle and the budget balance is even clearer if we compare the budget deficit as a percentage of GDP with the unemployment rate, as we do in Figure 32-2. The budget deficit almost always rises when the unemployment rate rises and falls when the unemployment rate falls.
Source: Federal Reserve Bank of St. Louis.
Is this relationship between the business cycle and the budget balance evidence that policy makers engage in discretionary fiscal policy, using expansionary fiscal policy during recessions and contractionary fiscal policy during expansions? Not necessarily. To a large extent the relationship in Figure 32-2 reflects automatic stabilizers at work. As we learned in the discussion of automatic stabilizers, government tax revenue tends to rise and some government transfers, like unemployment benefit payments, tend to fall when the economy expands. Conversely, government tax revenue tends to fall and some government transfers tend to rise when the economy contracts. So the budget balance tends to move toward surplus during expansions and toward deficit during recessions even without any deliberate action on the part of policy makers.
In assessing budget policy, it’s often useful to separate movements in the budget balance due to the business cycle from movements due to discretionary fiscal policy changes. The former are affected by automatic stabilizers and the latter by deliberate changes in government purchases, government transfers, or taxes.
It’s important to realize that business-
The cyclically adjusted budget balance is an estimate of what the budget balance would be if real GDP were exactly equal to potential output.
To separate the effect of the business cycle from the effects of other factors, many governments produce an estimate of what the budget balance would be if there were neither a recessionary nor an inflationary gap. The cyclically adjusted budget balance is an estimate of what the budget balance would be if real GDP were exactly equal to potential output. It takes into account the extra tax revenue the government would collect and the transfers it would save if a recessionary gap were eliminated—
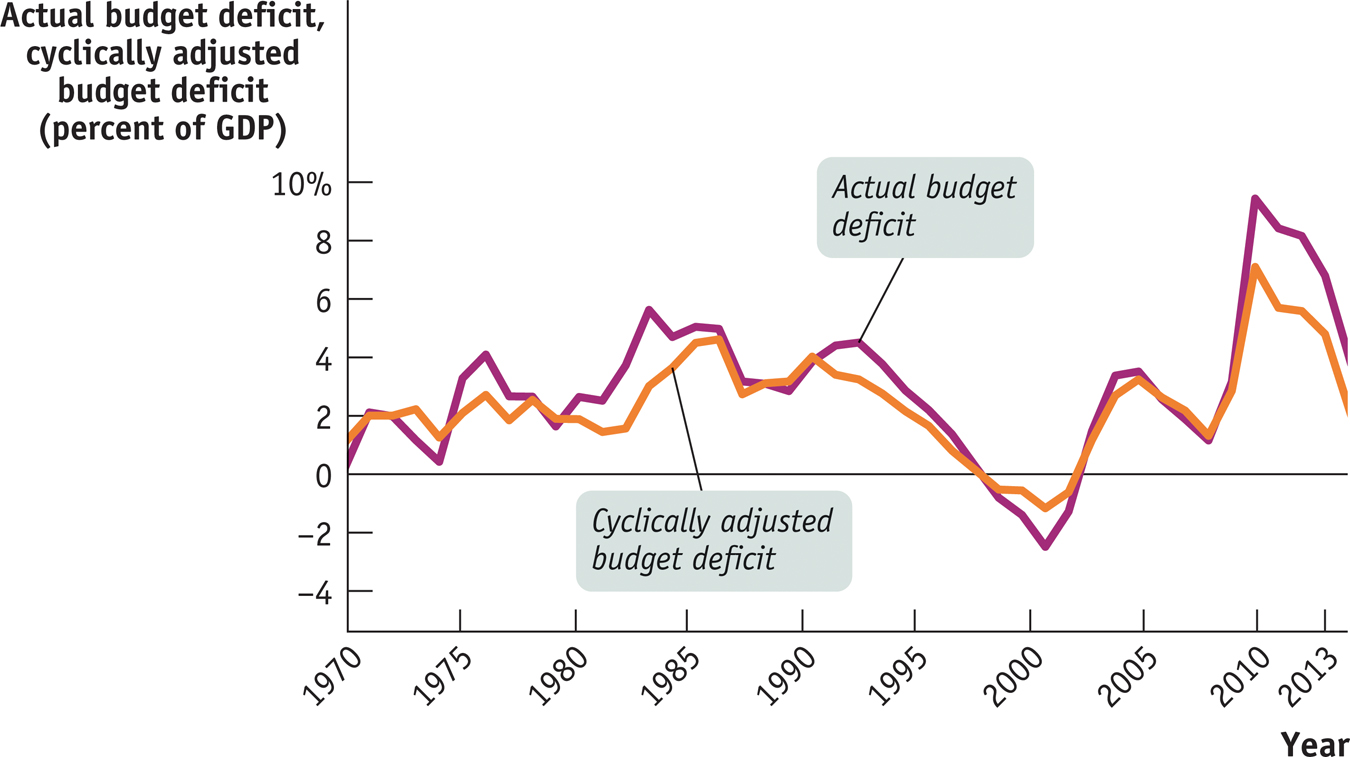
Figure 32-3 shows the actual budget deficit and the Congressional Budget Office estimate of the cyclically adjusted budget deficit, both as a percentage of GDP, from 1970 to 2013. As you can see, the cyclically adjusted budget deficit doesn’t fluctuate as much as the actual budget deficit. In particular, large actual deficits, such as those of 1975, 1983, and 2009, are usually caused in part by a depressed economy.
Sources: Congressional Budget Office; Bureau of Economic Analysis.
Should the Budget Be Balanced?
Persistent budget deficits can cause problems for both the government and the economy. Yet politicians are always tempted to run deficits because this allows them to cater to voters by cutting taxes without cutting spending or by increasing spending without increasing taxes. As a result, there are occasional attempts by policy makers to force fiscal discipline by introducing legislation—
Most economists don’t think so. They believe that the government should only balance its budget on average—
As we’ve learned, the tendency of tax revenue to fall and transfers to rise when the economy contracts helps to limit the size of recessions. But falling tax revenue and rising transfer payments generated by a downturn in the economy push the budget toward deficit. If constrained by a balanced-
Yet policy makers concerned about excessive deficits sometimes feel that rigid rules prohibiting—
EUROPE’S SEARCH FOR A FISCAL RULE
In 1999 a group of European nations took a momentous step when they adopted a common currency, the euro, to replace their various national currencies, such as the French franc, the German mark, and the Italian lira. Along with the introduction of the euro came the creation of the European Central Bank, which sets monetary policy for the whole region.
As part of the agreement creating the new currency, governments of member countries signed on to the European “stability pact,” requiring each government to keep its budget deficit—
The pact was intended to prevent irresponsible deficit spending arising from political pressure that might eventually undermine the new currency. The stability pact, however, had a serious downside: in principle, it would force countries to slash spending and/or raise taxes whenever an economic downturn pushed their deficits above the critical level. This would turn fiscal policy into a force that worsens recessions instead of fighting them.
As it turned out, the stability pact proved impossible to enforce: European nations, including France and even Germany, with its reputation for fiscal probity, simply ignored the rule during the 2001 recession and its aftermath.
In 2011 the Europeans tried again, this time against the background of a severe debt crisis. In the wake of the 2008 financial crisis, Greece, Ireland, Portugal, Spain, and Italy lost the confidence of investors worried about their ability and/or willingness to repay all their debt—

Yet a return to the old stability pact didn’t seem to make sense. Among other things, the stability pact’s rule on the size of budget deficits would not have done much to prevent the crisis—
So the agreement reached in December 2011 was framed in terms of the “structural” budget balance, more or less corresponding to the cyclically adjusted budget balance as we defined it in the text. According to the new rule, the structural budget balance of each country should be very nearly zero, with deficits not to exceed 0.5% of GDP. This seemed like a much better rule than the old stability pact.
Yet big problems remained. One was a question about the reliability of the estimates of the structural budget balances. Also, the new rule seemed to ban the use of discretionary fiscal policy, under any circumstances. Was this wise?
Before patting themselves on the back over the superiority of their own fiscal rules, Americans should note that the United States has its own version of the original, flawed European stability pact. The federal government’s budget acts as an automatic stabilizer, but 49 of the 50 states are required by their state constitutions to balance their budgets every year. When recession struck in 2008, most states were forced to—
Long-Run Implications of Fiscal Policy

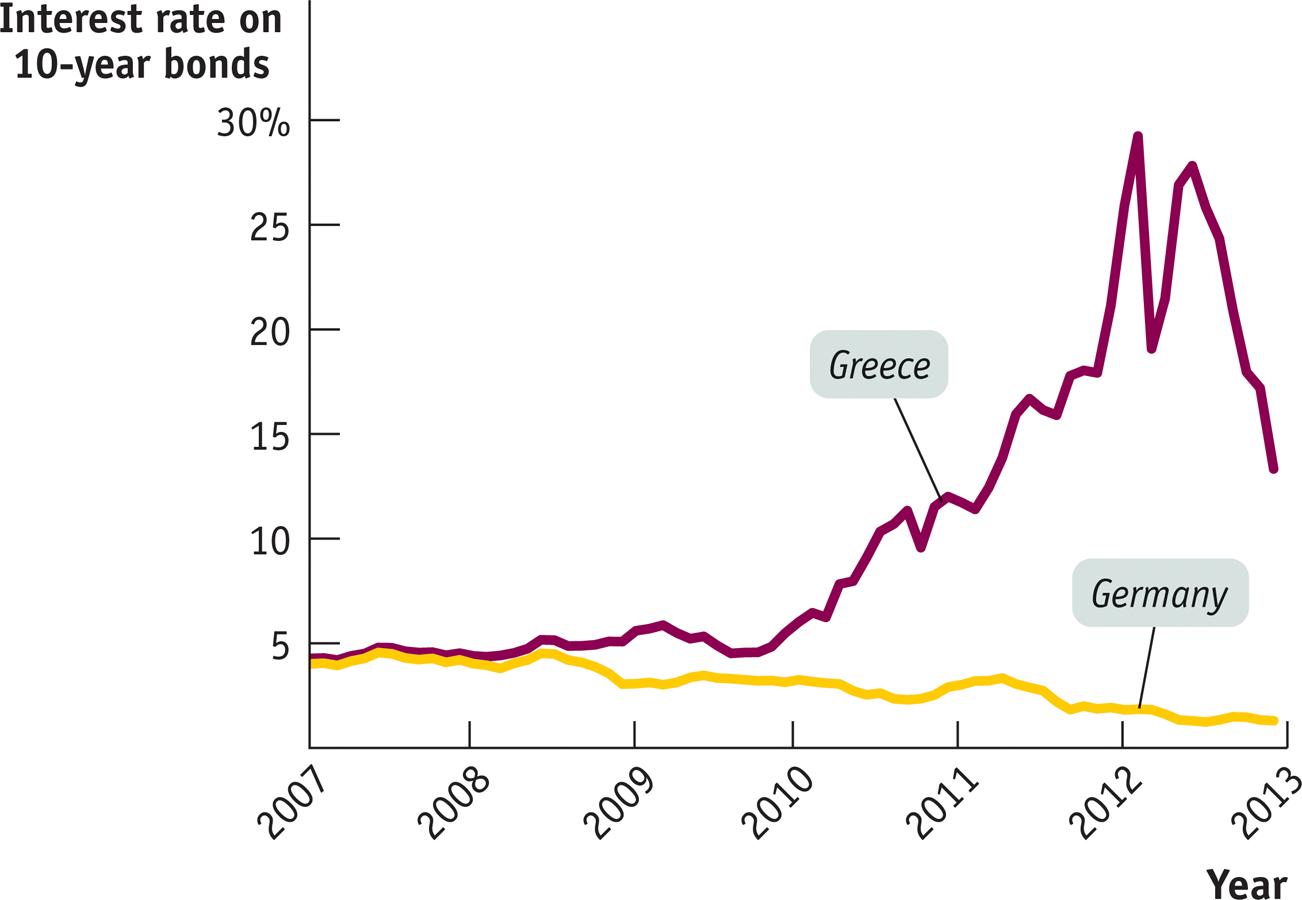
In 2009 the government of Greece ran into a financial wall. Like most other governments in Europe (and the U.S. government, too), the Greek government was running a large budget deficit, which meant that it needed to keep borrowing more funds, both to cover its expenses and to pay off existing loans as they came due. But governments, like companies or individuals, can only borrow if lenders believe there’s a good chance they are willing or able to repay their debts. By 2009 most investors, having lost confidence in Greece’s financial future, were no longer willing to lend to the Greek government. Those few who were willing to lend demanded very high interest rates to compensate them for the risk of loss.
Figure 32-4 compares interest rates on 10-
Source: European Central Bank.
Why was Greece having these problems? Largely because investors had become deeply worried about the level of its debt (in part because it became clear that the Greek government had been using creative accounting to hide just how much debt it had already taken on). Government debt is, after all, a promise to make future payments to lenders. By 2009 it seemed likely that the Greek government had already promised more than it could possibly deliver.
The result was that Greece found itself unable to borrow more from private lenders; it received emergency loans from other European nations and the International Monetary Fund, but these loans came with the requirement that the Greek government make severe spending cuts, which wreaked havoc with its economy, imposed severe economic hardship on Greeks, and led to massive social unrest.
No discussion of fiscal policy is complete if it doesn’t take into account the long-
Deficits, Surpluses, and Debt
When a family spends more than it earns over the course of a year, it has to raise the extra funds either by selling assets or by borrowing. And if a family borrows year after year, it will eventually end up with a lot of debt.
The same is true for governments. With a few exceptions, governments don’t raise large sums by selling assets such as national parkland. Instead, when a government spends more than the tax revenue it receives—
A fiscal year runs from October 1 to September 30 and is labeled according to the calendar year in which it ends.
To interpret the numbers that follow, you need to know a slightly peculiar feature of federal government accounting. For historical reasons, the U.S. government does not keep books by calendar years. Instead, budget totals are kept by fiscal years, which run from October 1 to September 30 and are labeled by the calendar year in which they end. For example, fiscal 2010 began on October 1, 2009, and ended on September 30, 2010.
Public debt is government debt held by individuals and institutions outside the government.
At the end of fiscal 2013, the U.S. federal government had total debt equal to $16.7 trillion. However, part of that debt represented special accounting rules specifying that the federal government as a whole owes funds to certain government programs, especially Social Security. We’ll explain those rules shortly. For now, however, let’s focus on public debt: government debt held by individuals and institutions outside the government. At the end of fiscal 2013, the federal government’s public debt was “only” $12.0 trillion, or 71% of GDP. If we include the debts of state and local governments, total public debt at the end of fiscal 2013 was larger than it was at the end of fiscal 2012 because the federal government ran a budget deficit during fiscal 2013. A government that runs persistent budget deficits will experience a rising level of public debt. Why is this a problem?
Problems Posed by Rising Government Debt
There are two reasons to be concerned when a government runs persistent budget deficits. We described the first reason in an earlier module: when the economy is at full employment and the government borrows funds in the financial markets, it is competing with firms that plan to borrow funds for investment spending. As a result, the government’s borrowing may crowd out private investment spending, increasing interest rates and reducing the economy’s long-
But there’s a second reason: today’s deficits, by increasing the government’s debt, place financial pressure on future budgets. The impact of current deficits on future budgets is straightforward. Like individuals, governments must pay their bills, including interest payments on their accumulated debt. When a government is deeply in debt, those interest payments can be substantial. In fiscal 2013, the U.S. federal government paid 1.3% of GDP—

Other things equal, a government paying large sums in interest must raise more revenue from taxes or spend less than it would otherwise be able to afford—
Americans aren’t used to the idea of government default, but such things do happen. In the 1990s Argentina, a relatively high-
Default creates havoc in a country’s financial markets and badly shakes public confidence in the government and the economy. Argentina’s debt default was accompanied by a crisis in the country’s banking system and a very severe recession.
And even if a highly indebted government avoids default, a heavy debt burden typically forces it to slash spending or raise taxes, politically unpopular measures that can also damage the economy. In some cases, “austerity” measures intended to reassure lenders that the government can indeed pay end up depressing the economy so much that lender confidence continues to fall, a situation faced to varying degrees by Greece, Ireland, Portugal, Spain, and Italy at the end of 2013.
Some may ask, why can’t a government that has trouble borrowing just print money to pay its bills? Yes, it can if it has its own currency (which the troubled European nations don’t). But printing money to pay the government’s bills can lead to another problem: inflation. Governments do not want to find themselves in a position where the choice is between defaulting on their debts and inflating those debts away by printing money.
Concerns about the long-
Deficits and Debt in Practice
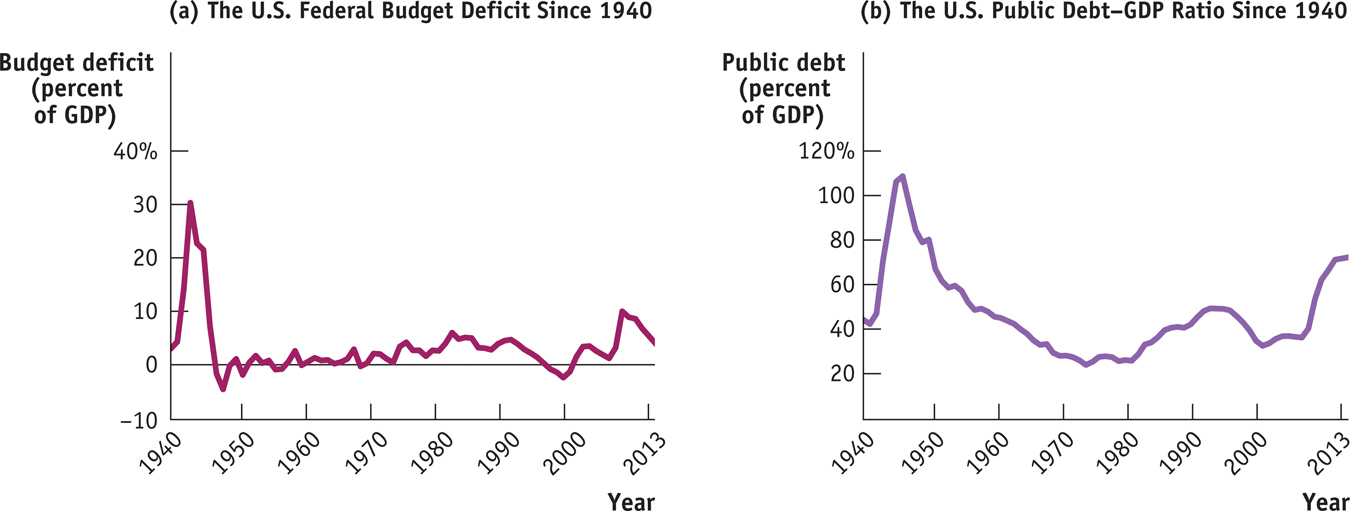
Figure 32-5 shows how the U.S. federal government’s budget deficit and its debt evolved from 1940 to 2013. Panel (a) shows the federal deficit as a percentage of GDP. As you can see, the federal government ran huge deficits during World War II. It briefly ran surpluses after the war, but it has normally run deficits ever since, especially after 1980. This seems inconsistent with the advice that governments should offset deficits in bad times with surpluses in good times.
Source: Office of Management and Budget.
The debt–
However, panel (b) of Figure 32-5 shows that for most of the period these persistent deficits didn’t lead to runaway debt. To assess the ability of governments to pay their debt, we use the debt–
What we see from panel (b) is that although the federal debt grew in almost every year, the debt–
Still, a government that runs persistent large deficits will have a rising debt–
Economists and policy makers agreed that this was not a sustainable trend, that governments would need to get their spending and revenues back in line. But when to bring spending in line with revenue was a source of great disagreement. Some argued for fiscal tightening right away; others argued that this tightening should be postponed until the major economies had recovered from their slump.
Implicit Liabilities
Implicit liabilities are spending promises made by governments that are effectively a debt despite the fact that they are not included in the usual debt statistics.
Looking at Figure 32-5, you might be tempted to conclude that until the 2008 crisis struck, the U.S. federal budget was in fairly decent shape: the return to budget deficits after 2001 caused the debt–
The largest implicit liabilities of the U.S. government arise from two transfer programs that principally benefit older Americans: Social Security and Medicare. The third-
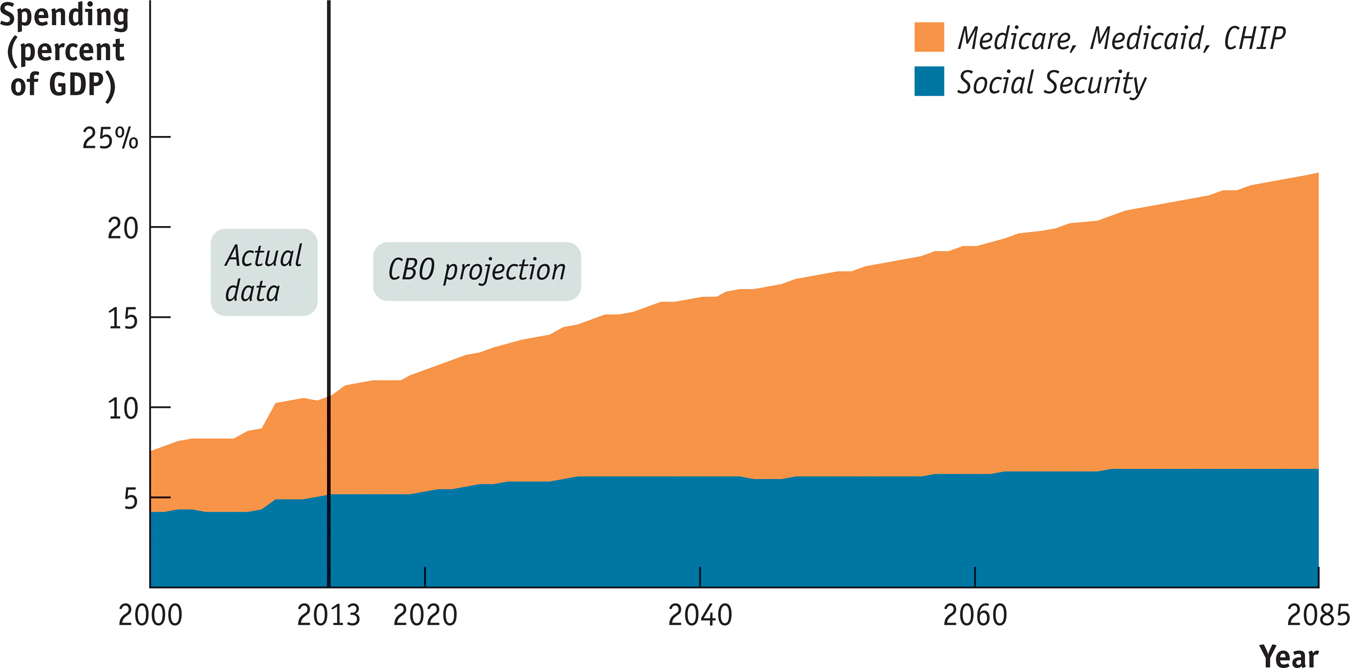
The implicit liabilities created by these transfer programs worry fiscal experts. Figure 32-6 shows why. It shows actual spending on Social Security and on Medicare, Medicaid, and CHIP (a program that provides health care coverage to uninsured children) as percentages of GDP from 2000 to 2013, together with Congressional Budget Office projections of spending through 2085. According to these projections, spending on Social Security will rise substantially over the next few decades and spending on the three health care programs will soar. Why?
Source: Congressional Budget Office.
In the case of Social Security, the answer is demography. Social Security is a “pay-
There was a huge surge in the U.S. birth rate between 1946 and 1964, commonly called the “baby boom.” Most baby boomers are currently of working age—
In 2013 there were 35 retirees receiving benefits for every 100 workers paying into the system. By 2030, according to the Social Security Administration, that number will rise to 46; by 2050, it will rise to 48; and by 2080, that number will be 51. So as baby boomers move into retirement, benefit payments will continue to rise relative to the size of the economy.
The aging of the baby boomers, by itself, poses only a moderately sized long-
To some extent, the implicit liabilities of the U.S. government are already reflected in debt statistics. We mentioned earlier that the government had a total debt of $16.7 trillion at the end of fiscal 2013 but that only $12.0 trillion of that total was owed to the public. The main explanation for that discrepancy is that both Social Security and part of Medicare (the hospital insurance program) are supported by dedicated taxes: their expenses are paid out of special taxes on wages. At times, these dedicated taxes yield more revenue than is needed to pay current benefits.
In particular, since the mid-
The money in the trust fund is held in the form of U.S. government bonds, which are included in the $16.7 trillion in total debt. You could say that there’s something funny about counting bonds in the Social Security trust fund as part of government debt. After all, these bonds are owed by one part of the government (the government outside the Social Security system) to another part of the government (the Social Security system itself). But the debt corresponds to a real, if implicit, liability: promises by the government to pay future retirement benefits.
So many economists argue that the gross debt of $16.7 trillion, the sum of public debt and government debt held by Social Security and other trust funds, is a more accurate indication of the government’s fiscal health than the smaller amount owed to the public alone.
32
Solutions appear at the back of the book.
Check Your Understanding
Why is the cyclically adjusted budget balance a better measure of whether government policies are sustainable in the long run than the actual budget balance?
The actual budget balance takes into account the effects of the business cycle on the budget deficit. During recessionary gaps, it incorporates the effect of lower tax revenues and higher transfers on the budget balance; during inflationary gaps, it incorporates the effect of higher tax revenues and reduced transfers. In contrast, the cyclically adjusted budget balance factors out the effects of the business cycle and assumes that real GDP is at potential output. Since, in the long run, real GDP tends to potential output, the cyclically adjusted budget balance is a better measure of the long-run sustainability of government policies.Explain why states required by their constitutions to balance their budgets are likely to experience more severe economic fluctuations than states not held to that requirement.
In recessions, real GDP falls. This implies that consumers’ incomes, consumer spending, and producers’ profits also fall. So in recessions, states’ tax revenue (which depends in large part on consumers’ incomes, consumer spending, and producers’ profits) falls. In order to balance the state budget, states have to cut spending or raise taxes. But that deepens the recession. Without a balanced-budget requirement, states could use expansionary fiscal policy during a recession to lessen the fall in real GDP.Explain how each of the following events would affect the public debt or implicit liabilities of the U.S. government, other things equal. Would the public debt or implicit liabilities be greater or smaller?
-
a. A higher growth rate of real GDP
A higher growth rate of real GDP implies that tax revenue will increase. If government spending remains constant and the government runs a budget surplus, the size of the public debt will be less than it would otherwise have been. -
b. Retirees live longer
If retirees live longer, the average age of the population increases. As a result, the implicit liabilities of the government increase because spending on programs for older Americans, such as Social Security and Medicare, will rise. -
c. A decrease in tax revenue
A decrease in tax revenue without offsetting reductions in government spending will cause the public debt to increase. -
d. Government borrowing to pay interest on its current public debt
Public debt will increase as a result of government borrowing to pay interest on its current public debt.
-
Multiple-
Question
Over the course of the business cycle
A. B. C. D. E. Question
The total debt of the U.S. federal government
A. B. C. D. E. Question
The budget balance tends to decline during a recession because
A. B. C. D. E. Question
During a recession the budget balance tends to __________ because of __________
A. B. C. D. E. Question
The cyclically adjusted budget balance estimates
A. B. C. D. E.
Critical-
Suppose the economy is in a slump and the current public debt is quite large. Explain the trade-
DEFICITS AND DEBT DO DIFFER
 What Is the difference between deficit and debt? Confusing deficit and debt is a common mistake—
 A DEFICIT IS THE DIFFERENCE BETWEEN THE AMOUNT OF MONEY A GOVERNMENT SPENDS AND THE AMOUNT IT RECEIVES IN TAXES OVER A GIVEN PERIOD — USUALLY, THOUGH NOT ALWAYS, A YEAR. A DEBT IS THE SUM OF MONEY A GOVERNMENT OWES AT A PARTICULAR POINT IN TIME. Deficit numbers always come with a statement about the time period to which they apply, as in “the U.S. budget deficit in fiscal 2013 was $683 billion.” Debt numbers usually come with a specific date, as in “U.S. public debt at the end of fiscal 2013 was $17 trillion.”
Although deficits and debt are linked, because government debt grows when governments run deficits, they aren’t the same thing, and they can even tell different stories. For example, Italy, which found itself in debt trouble in 2011, had a fairly small deficit by historical standards, but it had very high debt, a legacy of past policies.
To learn more, see pages 333–
