Implicit Liabilities
Implicit liabilities are spending promises made by governments that are effectively a debt despite the fact that they are not included in the usual debt statistics.
Looking at Figure 13-12, you might be tempted to conclude that until the 2008 crisis struck, the U.S. federal budget was in fairly decent shape: the return to budget deficits after 2001 caused the debt–
The largest implicit liabilities of the U.S. government arise from two transfer programs that principally benefit older Americans: Social Security and Medicare. The third-
The implicit liabilities created by these transfer programs worry fiscal experts. Figure 13-13 shows why. It shows actual spending on Social Security and on Medicare, Medicaid, and CHIP (a program that provides health care coverage to uninsured children) as percentages of GDP from 2000 to 2013, together with Congressional Budget Office projections of spending through 2038. According to these projections, spending on Social Security will rise substantially over the next few decades and spending on the three health care programs will soar. Why?
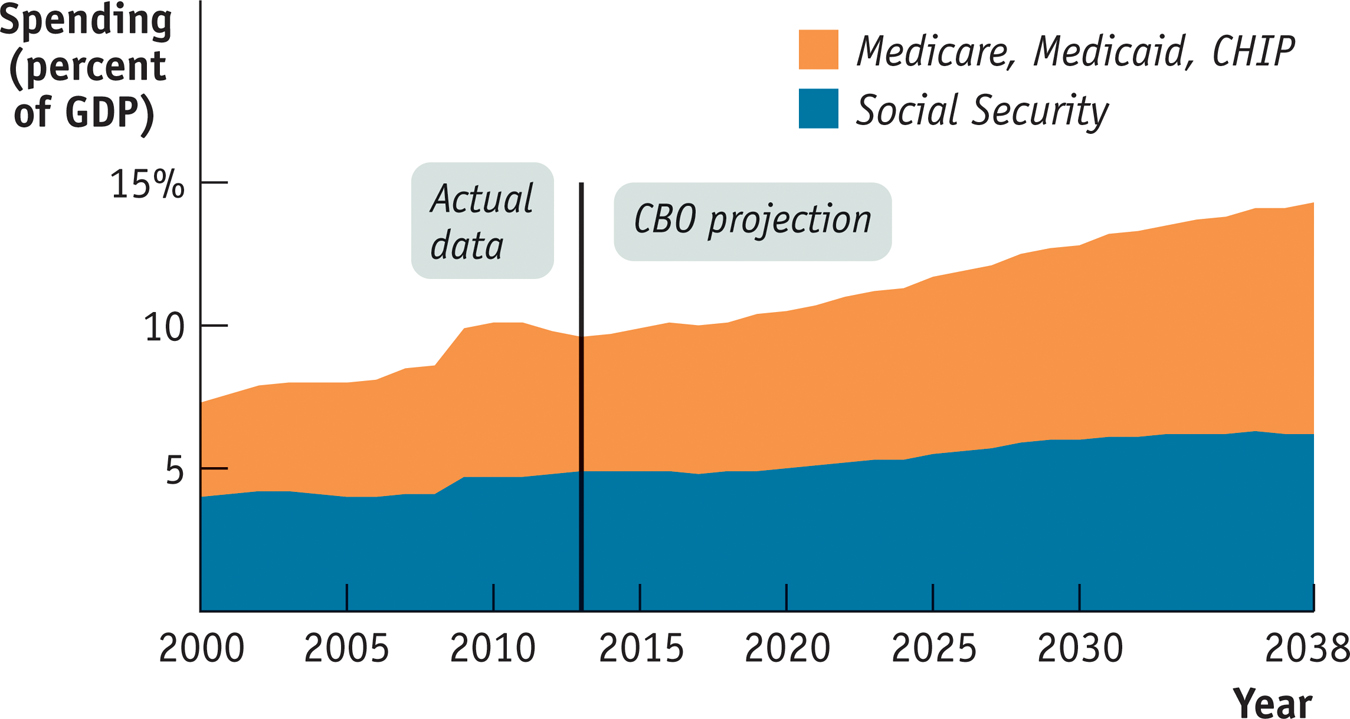
In the case of Social Security, the answer is demography. Social Security is a “pay-
There was a huge surge in the U.S. birth rate between 1946 and 1964, the years of what is commonly called the baby boom. Most baby boomers are currently of working age—
As a result, the ratio of retirees receiving benefits to workers paying into the Social Security system will rise. In 2010 there were 34 retirees receiving benefits for every 100 workers paying into the system. By 2030, according to the Social Security Administration, that number will rise to 46; by 2050, it will rise to 48; and by 2080, that number will be 51. So as baby boomers move into retirement, benefit payments will continue to rise relative to the size of the economy.
The aging of the baby boomers, by itself, poses only a moderately sized long-
To some extent, the implicit liabilities of the U.S. government are already reflected in debt statistics. We mentioned earlier that the government had a total debt of $17 trillion at the end of fiscal 2013 but that only $12 trillion of that total was owed to the public. The main explanation for that discrepancy is that both Social Security and part of Medicare (the hospital insurance program) are supported by dedicated taxes: their expenses are paid out of special taxes on wages. At times, these dedicated taxes yield more revenue than is needed to pay current benefits.
In particular, since the mid-
The money in the trust fund is held in the form of U.S. government bonds, which are included in the $17 trillion in total debt. You could say that there’s something funny about counting bonds in the Social Security trust fund as part of government debt. After all, these bonds are owed by one part of the government (the government outside the Social Security system) to another part of the government (the Social Security system itself). But the debt corresponds to a real, if implicit, liability: promises by the government to pay future retirement benefits.
So many economists argue that the gross debt of $17 trillion, the sum of public debt and government debt held by Social Security and other trust funds, is a more accurate indication of the government’s fiscal health than the smaller amount owed to the public alone.
!worldview! ECONOMICS in Action: Are We Greece?
Are We Greece?
In late 2009, Greece found itself in fiscal crisis, unable to borrow except at very high interest rates, and several other European countries soon found themselves in the same predicament. Meanwhile, the United States was also running large budget deficits and had debt that was high by historical standards. So was America at risk of turning into Greece?
Some influential people thought so, and many dire warnings were issued. For example, in 2010, Alan Greenspan, the former chairman of the Federal Reserve, published an editorial titled “U.S. Debt and the Greece Analogy,” in which he warned that the United States could soon face soaring interest rates. In 2011, Erskine Bowles and Alan Simpson, co-
In fact, U.S. borrowing costs remained low into 2014, with no hint of a cutoff of lending. But was America just lucky?
Not according to a number of economists, especially the Belgian economist Paul De Grauwe, who began arguing in 2011 that the currency in which a country borrows makes a crucial difference. While the United States has a lot of government debt, it’s in dollars; similarly, Britain’s debt is in pounds, and Japan’s debt is in yen. Greece, Spain, and Portugal, by contrast, no longer have their own currencies; their debts are in euros.
Why does this matter? As we’ve explained previously, even the United States can’t always rely on printing money to cover its deficits, because doing so can lead to runaway inflation. But the ability to print dollars does mean that the U.S. government can’t run out of cash. This, in turn, means that we’re not vulnerable to fiscal panic, in which investors fear a sudden default and, by refusing to lend, cause the very default they fear. And De Grauwe argued that the woes of European debtors were largely driven by the risk of such a fiscal panic.
Figure 13-14 shows some evidence for De Grauwe’s view. It compares net debt as a percentage of GDP with interest rates on government bonds for a number of countries in 2012, the worst year of the European debt crisis. The purple markers correspond to countries on the euro—
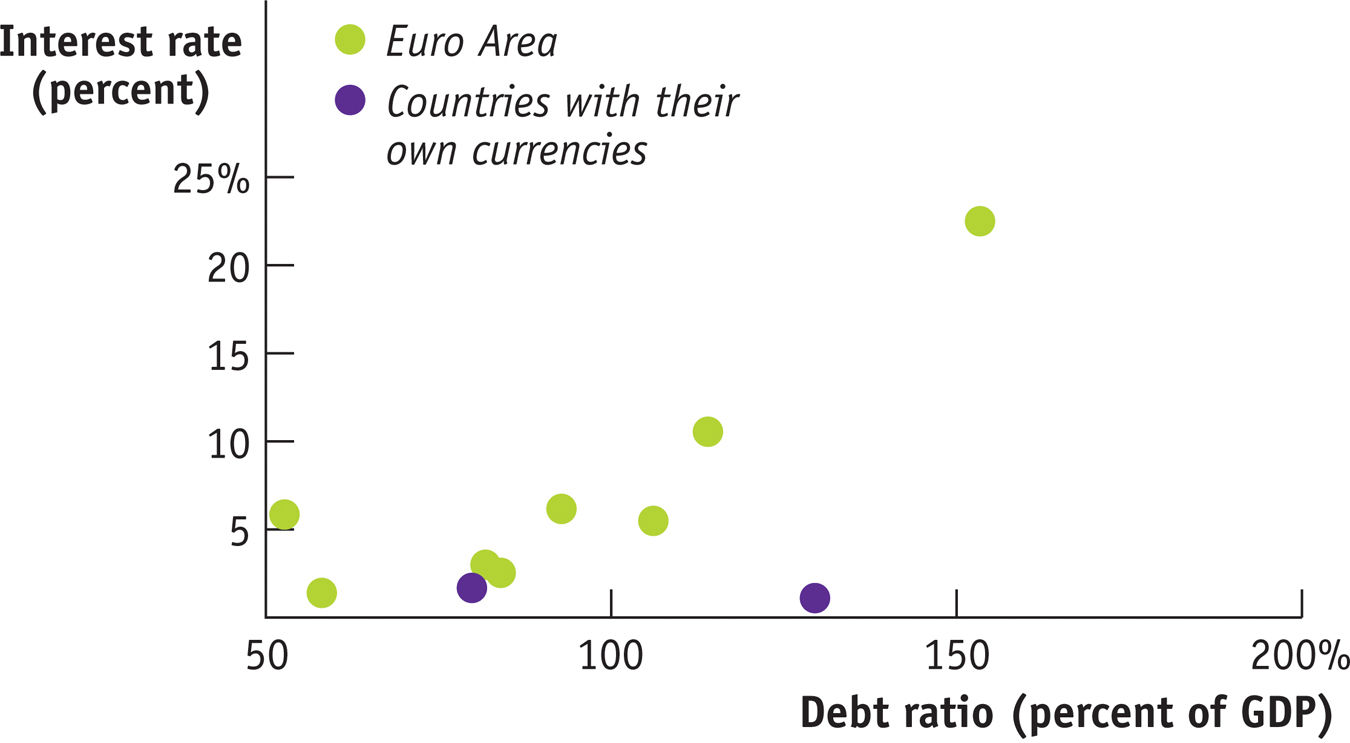
In fact, as we’ve seen, even within the euro area, borrowing costs of high-
In any case, by 2014, warnings that the United States was about to turn into Greece had mostly vanished. There are many risks facing America, but that doesn’t seem to be anywhere near the top of the list.
Quick Review
Persistent budget deficits lead to increases in public debt.
Rising public debt can lead to government default. In less extreme cases, it can crowd out investment spending, reducing long-
run growth. This suggests that budget deficits in bad fiscal years should be offset with budget surpluses in good fiscal years. A widely used indicator of fiscal health is the debt–
GDP ratio. A country with rising GDP can have a stable or falling debt– GDP ratio even if it runs budget deficits if GDP is growing faster than the debt. In addition to their official public debt, modern governments have implicit liabilities. The U.S. government has large implicit liabilities in the form of Social Security, Medicare, and Medicaid.
13-4
Question 13.9
Explain how each of the following events would affect the public debt or implicit liabilities of the U.S. government, other things equal. Would the public debt or implicit liabilities be greater or smaller?
A higher growth rate of real GDP
Retirees live longer
A decrease in tax revenue
Government borrowing to pay interest on its current public debt
Question 13.10
Suppose the economy is in a slump and the current public debt is quite large. Explain the trade-
off of short- run versus long- run objectives that policy makers face when deciding whether or not to engage in deficit spending. Question 13.11
Explain how a policy of fiscal austerity can make it more likely that a government is unable to pay its debts.
Solutions appear at back of book.
Here Comes the Sun

The Solana power plant, which opened in 2013, covers 3 square miles of the Arizona desert in Gila Bend, about 70 miles from Phoenix. Whereas most solar installations rely on photovoltaic panels that convert light directly into electricity, Solana uses a system of mirrors to concentrate the sun’s heat on black pipes, which convey that heat to tanks of molten salt. The heat in the salt is, in turn, used to generate electricity. The advantage of this arrangement is that the plant can keep generating power long after the sun has gone down, greatly enhancing its efficiency.
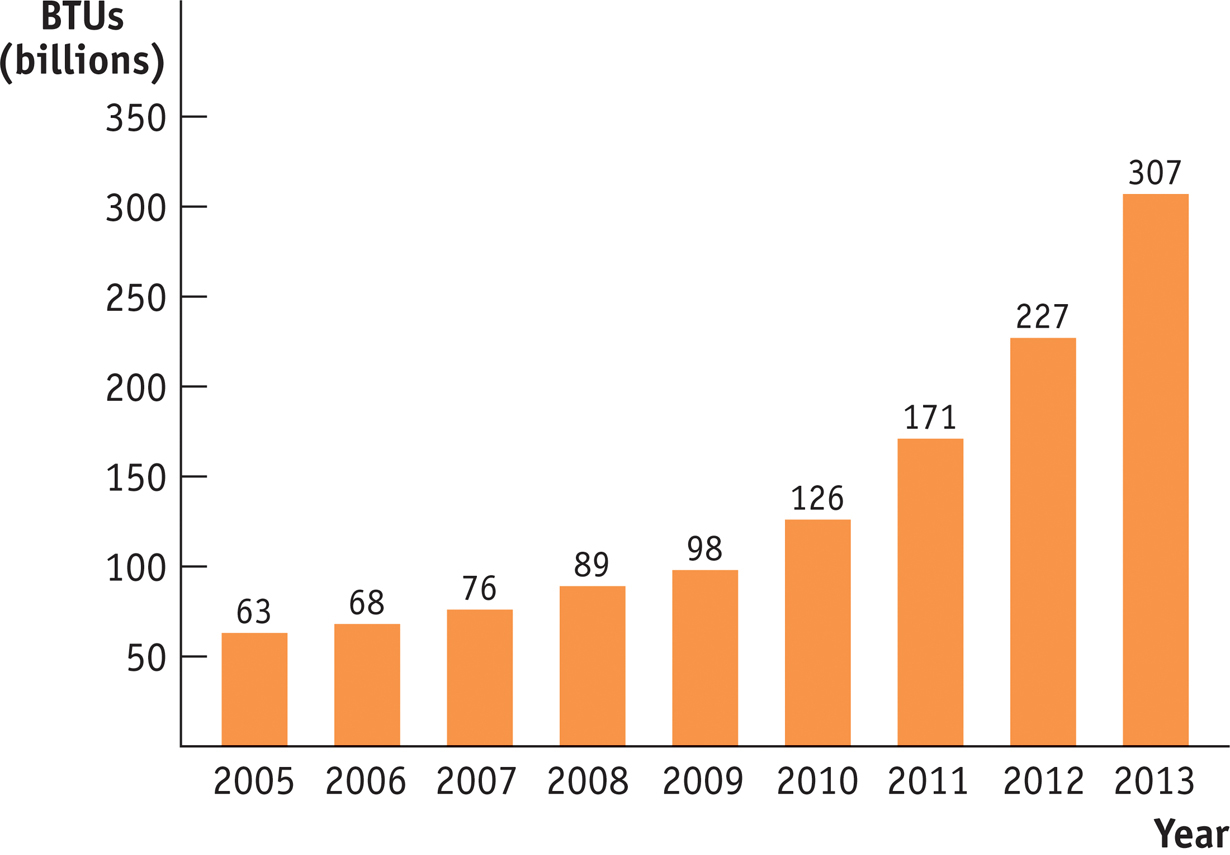
Solana is one of only a small number of concentrated thermal solar plants operating or under construction, and as Figure 13-15 shows, solar power has been rapidly rising in importance, with the amount of electricity generated by solar almost quadrupling between 2008 and 2013. There are a number of reasons for this sudden rise, but the Obama stimulus—
While Solana is a good example of stimulus spending at work, it is also a good example of why such spending tends to be politically difficult. There were many protests over federal loans to a non-
In terms of the goals of the stimulus, however, Solana seems to have done what it was supposed to: it generated jobs at a time when borrowing was cheap and many construction workers were unemployed.
QUESTIONS FOR THOUGHT
Question 13.12
How did the political reaction to government funding for the Solana project differ from the reaction to more conventional government spending projects such as roads and schools? What does the case tell us about how to assess the value of a fiscal stimulus project?
Question 13.13
In the chapter we talked about the problem of lags in discretionary fiscal policy. What does the Solana case tell us about this issue?
Question 13.14
Is the depth of a recession a good or a bad time to undertake an energy project? Why or why not?