The Anatomy of Quantity Controls
To understand why a New York taxi medallion is worth so much money, we consider a simplified version of the market for taxi rides, shown in Figure 4-7. Just as we assumed in the analysis of rent control that all apartments are the same, we now suppose that all taxi rides are the same—
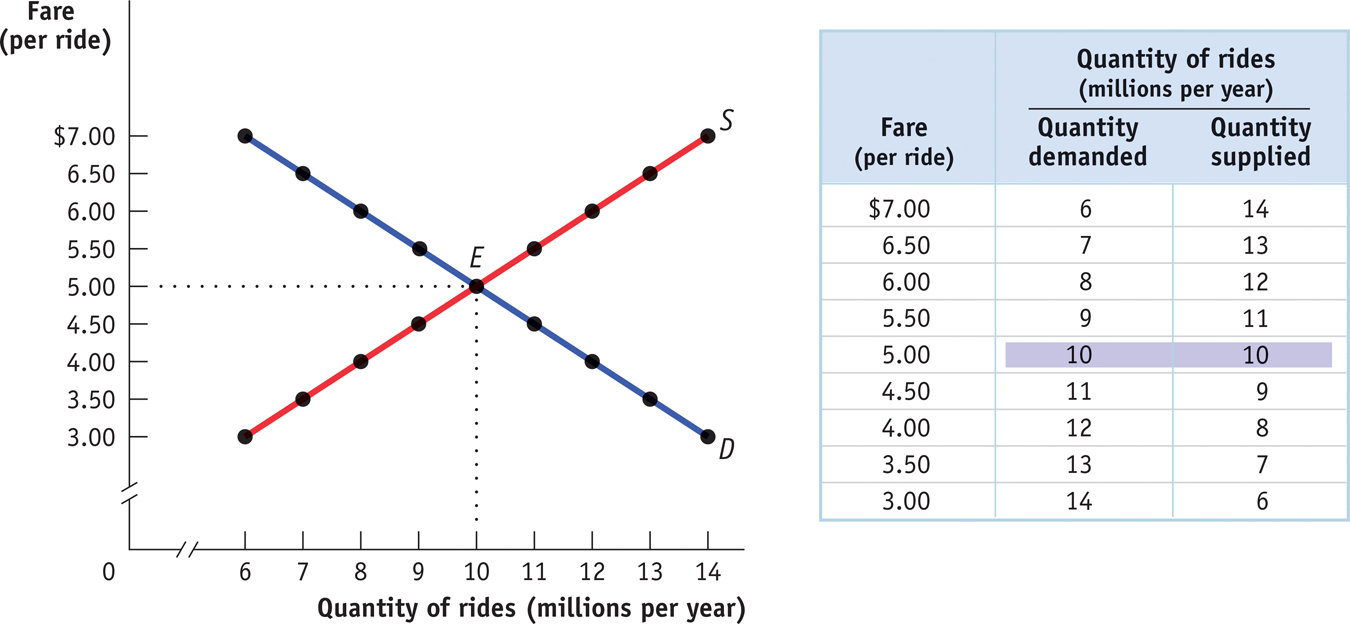
The table in the figure shows supply and demand schedules. The equilibrium—
The New York medallion system limits the number of taxis, but each taxi driver can offer as many rides as he or she can manage. (Now you know why New York taxi drivers are so aggressive!) To simplify our analysis, however, we will assume that a medallion system limits the number of taxi rides that can legally be given to 8 million per year.
The demand price of a given quantity is the price at which consumers will demand that quantity.
Until now, we have derived the demand curve by answering questions of the form: “How many taxi rides will passengers want to take if the price is $5 per ride?” But it is possible to reverse the question and ask instead: “At what price will consumers want to buy 10 million rides per year?” The price at which consumers want to buy a given quantity—
The supply price of a given quantity is the price at which producers will supply that quantity.
Similarly, the supply curve represents the answer to questions of the form: “How many taxi rides would taxi drivers supply at a price of $5 each?” But we can also reverse this question to ask: “At what price will suppliers be willing to supply 10 million rides per year?” The price at which suppliers will supply a given quantity—
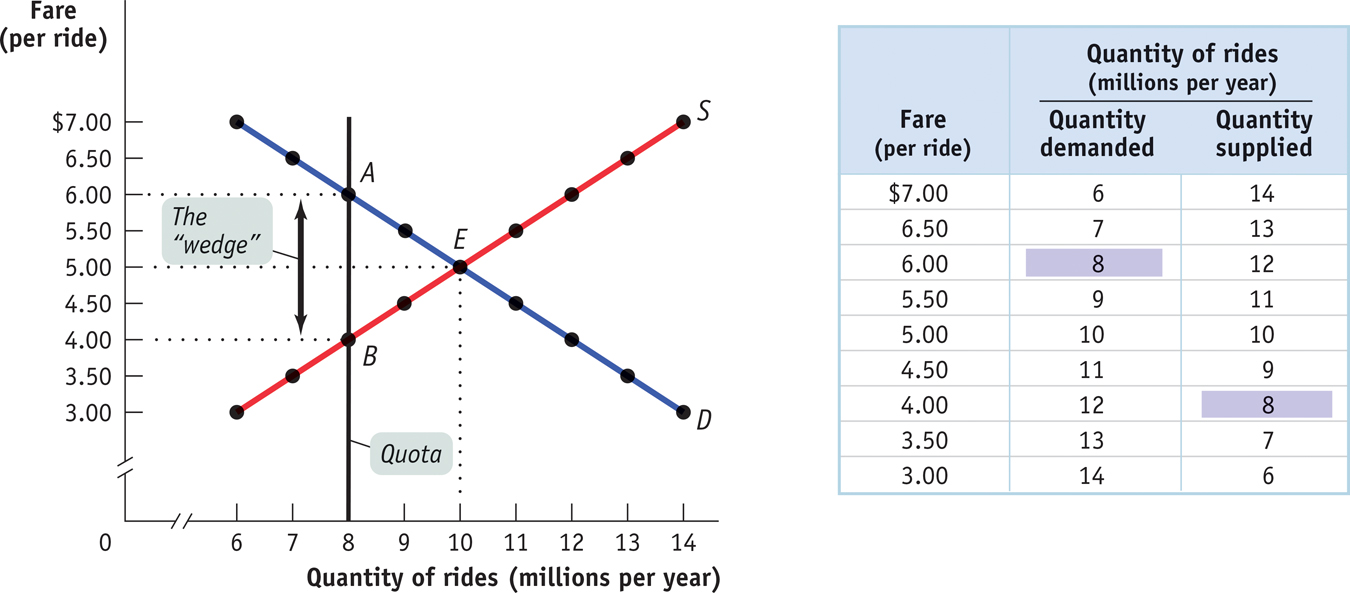
Now we are ready to analyze a quota. We have assumed that the city government limits the quantity of taxi rides to 8 million per year. Medallions, each of which carries the right to provide a certain number of taxi rides per year, are made available to selected people in such a way that a total of 8 million rides will be provided. Medallion-
Figure 4-8 shows the resulting market for taxi rides, with the black vertical line at 8 million rides per year representing the quota limit. Because the quantity of rides is limited to 8 million, consumers must be at point A on the demand curve, corresponding to the shaded entry in the demand schedule: the demand price of 8 million rides is $6 per ride. Meanwhile, taxi drivers must be at point B on the supply curve, corresponding to the shaded entry in the supply schedule: the supply price of 8 million rides is $4 per ride.
But how can the price received by taxi drivers be $4 when the price paid by taxi riders is $6? The answer is that in addition to the market in taxi rides, there is also a market in medallions. Medallion-
So we need to consider two sets of transactions here, and so two prices: (1) the transactions in taxi rides and the price at which these will occur, and (2) the transactions in medallions and the price at which these will occur. It turns out that since we are looking at two markets, the $4 and $6 prices will both be right.
To see how this all works, consider two imaginary New York taxi drivers, Sunil and Harriet. Sunil has a medallion but can’t use it because he’s recovering from a severely sprained wrist. So he’s looking to rent his medallion out to someone else. Harriet doesn’t have a medallion but would like to rent one. Furthermore, at any point in time there are many other people like Harriet who would like to rent a medallion. Suppose Sunil agrees to rent his medallion to Harriet. To make things simple, assume that any driver can give only one ride per day and that Sunil is renting his medallion to Harriet for one day. What rental price will they agree on?
To answer this question, we need to look at the transactions from the viewpoints of both drivers. Once she has the medallion, Harriet knows she can make $6 per day—
A quantity control, or quota, drives a wedge between the demand price and the supply price of a good; that is, the price paid by buyers ends up being higher than that received by sellers.
It is no coincidence that $2 is exactly the difference between $6, the demand price of 8 million rides, and $4, the supply price of 8 million rides. In every case in which the supply of a good is legally restricted, there is a wedge between the demand price of the quantity transacted and the supply price of the quantity transacted.
The difference between the demand and supply price at the quota limit is the quota rent, the earnings that accrue to the license-
This wedge, illustrated by the double-
So Figure 4-8 also illustrates the quota rent in the market for New York taxi rides. The quota limits the quantity of rides to 8 million per year, a quantity at which the demand price of $6 exceeds the supply price of $4. The wedge between these two prices, $2, is the quota rent that results from the restrictions placed on the quantity of taxi rides in this market.
But wait a second. What if Sunil doesn’t rent out his medallion? What if he uses it himself? Doesn’t this mean that he gets a price of $6? No, not really. Even if Sunil doesn’t rent out his medallion, he could have rented it out, which means that the medallion has an opportunity cost of $2: if Sunil decides to use his own medallion and drive his own taxi rather than renting his medallion to Harriet, the $2 represents his opportunity cost of not renting out his medallion. That is, the $2 quota rent is now the rental income he forgoes by driving his own taxi.
In effect, Sunil is in two businesses—
So regardless of whether the medallion owner uses the medallion himself or herself, or rents it to others, it is a valuable asset. And this is represented in the going price for a New York City taxi medallion: in 2013, New York City taxi medallions sold for $1 to $1.2 million. According to Simon Greenbaum, a broker of New York taxi medallions, an owner of a medallion who leases it to a driver can expect to earn about $2,500 per month, or a 3% return—
Notice, by the way, that quotas—