Sources of Comparative Advantage
International trade is driven by comparative advantage, but where does comparative advantage come from? Economists who study international trade have found three main sources of comparative advantage: international differences in climate, international differences in factor endowments, and international differences in technology.
Differences in Climate One key reason the opportunity cost of producing shrimp in Vietnam and Thailand is less than in the United States is that shrimp need warm water—

Differences in Factor Endowments Canada is a major exporter of forest products—
Forestland, like labor and capital, is a factor of production: an input used to produce goods and services. (Recall from Chapter 2 that the factors of production are land, labor, physical capital, and human capital.) Due to history and geography, the mix of available factors of production differs among countries, providing an important source of comparative advantage. The relationship between comparative advantage and factor availability is found in an influential model of international trade, the Heckscher–
The factor intensity of production of a good is a measure of which factor is used in relatively greater quantities than other factors in production.
Two key concepts in the model are factor abundance and factor intensity. Factor abundance refers to how large a country’s supply of a factor is relative to its supply of other factors. Factor intensity refers to the fact that producers use different ratios of factors of production in the production of different goods. For example, oil refineries use much more capital per worker than clothing factories. Economists use the term factor intensity to describe this difference among goods: oil refining is capital-
According to the Heckscher–
According to the Heckscher–
The basic intuition behind this result is simple and based on opportunity cost. The opportunity cost of a given factor—
The most dramatic example of the validity of the Heckscher–
The fact that international trade is the result of differences in factor endowments helps explain another fact: international specialization of production is often incomplete. That is, a country often maintains some domestic production of a good that it imports. A good example of this is the United States and oil. Saudi Arabia exports oil to the United States because Saudi Arabia has an abundant supply of oil relative to its other factors of production; the United States exports medical devices to Saudi Arabia because it has an abundant supply of expertise in medical technology relative to its other factors of production. But the United States also produces some oil domestically because the size of its domestic oil reserves in Texas and Alaska (and now, increasingly, its oil shale reserves elsewhere) makes it economical to do so.
In our supply and demand analysis in the next section, we’ll consider incomplete specialization by a country to be the norm. We should emphasize, however, that the fact that countries often incompletely specialize does not in any way change the conclusion that there are gains from trade.
Differences in Technology In the 1970s and 1980s, Japan became by far the world’s largest exporter of automobiles, selling large numbers to the United States and the rest of the world. Japan’s comparative advantage in automobiles wasn’t the result of climate. Nor can it easily be attributed to differences in factor endowments: aside from a scarcity of land, Japan’s mix of available factors is quite similar to that in other advanced countries. Instead, Japan’s comparative advantage in automobiles was based on the superior production techniques developed by its manufacturers, which allowed them to produce more cars with a given amount of labor and capital than their American or European counterparts.
!worldview! FOR INQUIRING MINDS: Increasing Returns to Scale and International Trade
Most analyses of international trade focuses on how differences between countries—
Production of a good is characterized by increasing returns to scale if the productivity of labor and other resources used in production rise with the quantity of output. For example, in an industry characterized by increasing returns to scale, increasing output by 10% might require only 8% more labor and 9% more raw materials. Examples of industries with increasing returns to scale include auto manufacturing, oil refining, and the production of jumbo jets, all of which require large outlays of capital. Increasing returns to scale (sometimes also called economies of scale) can give rise to monopoly, a situation in which an industry is composed of only one producer, because it gives large firms a cost advantage over small ones.
But increasing returns to scale can also give rise to international trade. The logic runs as follows: if production of a good is characterized by increasing returns to scale, it makes sense to concentrate production in only a few locations, so each location has a high level of output. But that also means production occurs in only a few countries that export the good to other countries. A commonly cited example is the North American auto industry: although both the United States and Canada produce automobiles and their components, each particular model or component tends to be produced in only one of the two countries and exported to the other. Increasing returns to scale probably play a large role in the trade in manufactured goods between advanced countries, which is about 25% of the total value of world trade.

Japan’s comparative advantage in automobiles was a case of comparative advantage caused by differences in technology—
The causes of differences in technology are somewhat mysterious. Sometimes they seem to be based on knowledge accumulated through experience—
!worldview! ECONOMICS in Action: How Hong Kong Lost Its Shirts
How Hong Kong Lost Its Shirts
The rise of Hong Kong was one of the most improbable-
During much of its ascent, Hong Kong’s rise rested, above all, on its clothing industry. In 1980 Hong Kong’s garment and textile sectors employed almost 450,000 workers, close to 20% of total employment. These workers overwhelmingly made apparel—
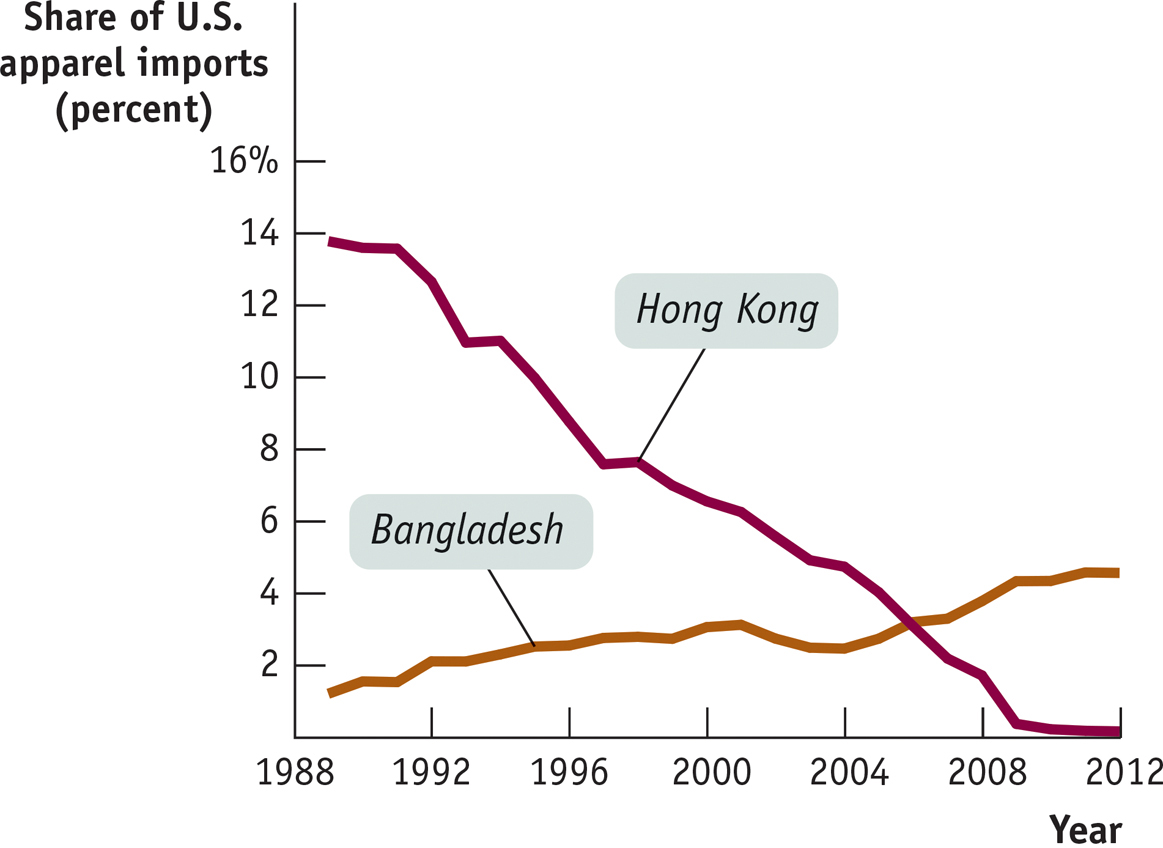
Since then, however, the Hong Kong clothing industry has fallen sharply in size—
Why did Hong Kong lose its comparative advantage in making shirts, pants, and so on? It wasn’t because the city’s garment workers became less productive. Instead, it was because the city got better at other things. Apparel production is a labor-
Quick Review
Imports and exports account for a growing share of the U.S. economy and the economies of many other countries.
The growth of international trade and other international linkages is known as globalization. Extremely high levels of international trade are known as hyperglobalization.
International trade is driven by comparative advantage. The Ricardian model of international trade shows that trade between two countries makes both countries better off than they would be in autarky—
that is, there are gains from international trade. The main sources of comparative advantage are international differences in climate, factor endowments, and technology.
The Heckscher–
Ohlin model shows how comparative advantage can arise from differences in factor endowments: goods differ in their factor intensity, and countries tend to export goods that are intensive in the factors they have in abundance.
5-1
Question 5.1
In the United States, the opportunity cost of 1 ton of corn is 50 bicycles. In China, the opportunity cost of 1 bicycle is 0.01 ton of corn.
Determine the pattern of comparative advantage.
In autarky, the United States can produce 200,000 bicycles if no corn is produced, and China can produce 3,000 tons of corn if no bicycles are produced. Draw each country’s production possibility frontier assuming constant opportunity cost, with tons of corn on the vertical axis and bicycles on the horizontal axis.
With trade, each country specializes its production. The United States consumes 1,000 tons of corn and 200,000 bicycles; China consumes 3,000 tons of corn and 100,000 bicycles. Indicate the production and consumption points on your diagrams, and use them to explain the gains from trade.
Question 5.2
Explain the following patterns of trade using the Heckscher–
Ohlin model. France exports wine to the United States, and the United States exports movies to France.
Brazil exports shoes to the United States, and the United States exports shoe-
making machinery to Brazil.
Solutions appear at back of book.