The Unemployment Rate

The U.S. unemployment rate in October 2014 was 5.8%. That was a substantial improvement from the situation a few years earlier. In late 2009, after the Great Recession, unemployment peaked at 10%. But unemployment was still well above pre-recession levels; it was only 4.7% in November 2007.

Figure 8-1 shows the U.S. unemployment rate from 1948 to late 2014; as you can see, unemployment soared during the Great Recession of 2007–2009 and fell only slowly in the years that followed. What did the elevated unemployment rate mean, and why was it such a big factor in people’s lives? To understand why policy makers pay so much attention to employment and unemployment, we need to understand how they are both defined and measured.

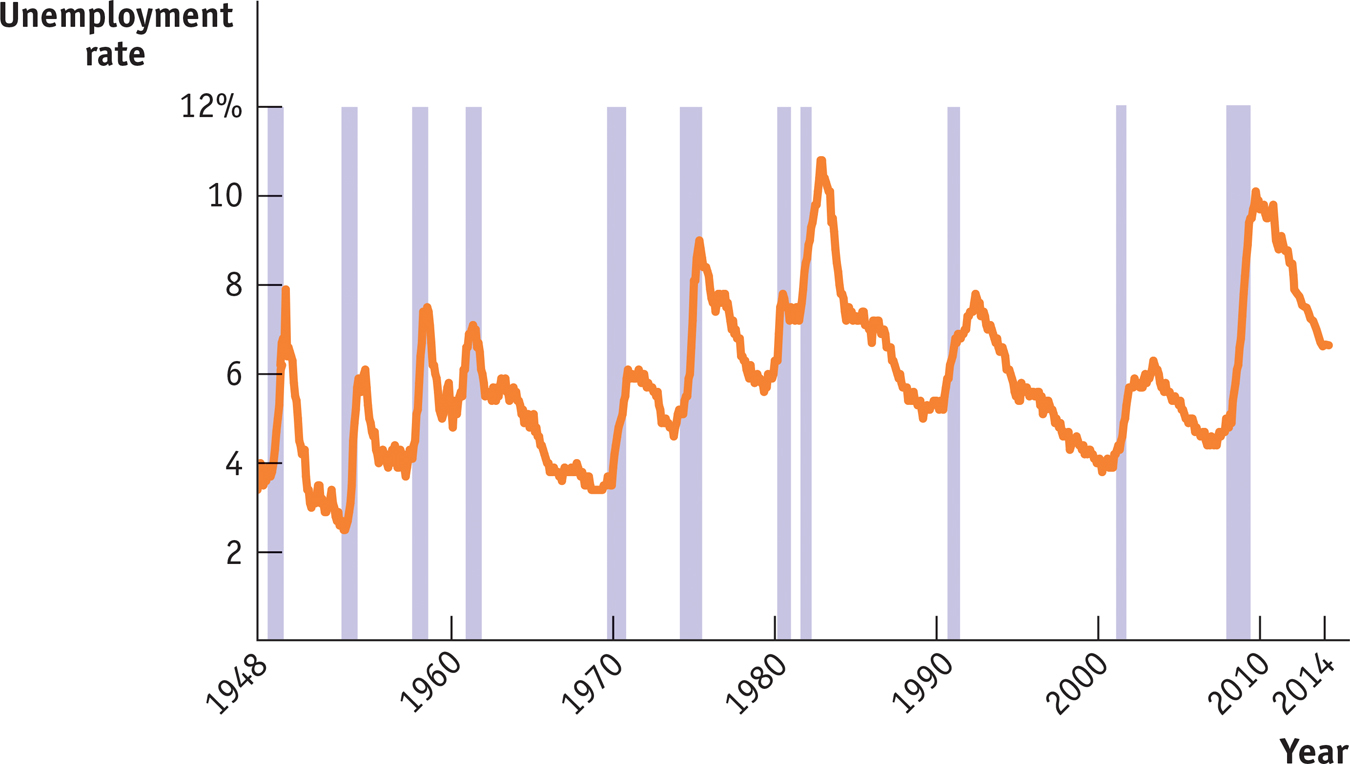
The U.S. Unemployment Rate, 1948–2014 The unemployment rate has fluctuated widely over time. It always rises during recessions, which are shown by the shaded bars. It usually, but not always, falls during periods of economic expansion. Sources: Bureau of Labor Statistics; National Bureau of Economic Research.