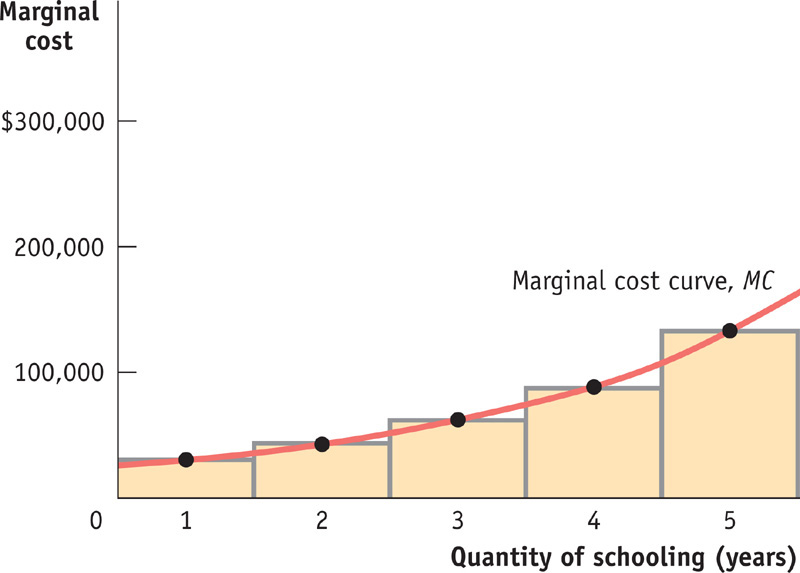
The height of each shaded bar corresponds to Alex’s marginal cost of an additional year of schooling. The height of each bar is higher than the preceding one because each year of schooling costs more than the previous years. As a result, Alex has increasing marginal cost and the marginal cost curve, the line connecting the midpoints at the top of each bar, is upward sloping.