Problems
1.Suppose it is decided that rent control in New York City will be abolished and that market rents will now prevail. Assume that all rental units are identical and are therefore offered at the same rent. To address the plight of residents who may be unable to pay the market rent, an income supplement will be paid to all low-
- a. Use a diagram to show the effect on the rental market of the elimination of rent control. What will happen to the quality and quantity of rental housing supplied?
- b. Now use a second diagram to show the additional effect of the income-
supplement policy on the market, namely the resulting increase in demand. What effect does it have on the market rent and quantity of rental housing supplied in comparison to your answers to part a? - c. Are tenants better or worse off as a result of these policies? Are landlords better or worse off?
- d. From a political standpoint, why do you think cities have been more likely to resort to rent control rather than a policy of income supplements to help low-
income people pay for housing?
2.In the late eighteenth century, the price of bread in New York City was controlled, set at a predetermined price above the market price.
- a. Draw a diagram showing the effect of the policy. Did the policy act as a price ceiling or a price floor?
- b. What kinds of inefficiencies were likely to have arisen when the controlled price of bread was above the market price? Explain in detail.
One year during this period, a poor wheat harvest caused a leftward shift in the supply of bread and therefore an increase in its market price. New York bakers found that the controlled price of bread in New York was below the market price. - c. Draw a diagram showing the effect of the price control on the market for bread during this one-
year period. Did the policy act as a price ceiling or a price floor? - d. What kinds of inefficiencies do you think occurred during this period? Explain in detail.
3.Suppose the U.S. government decides that the incomes of dairy farmers should be maintained at a level that allows the traditional family dairy farm to survive. It therefore implements a price floor of $1 per pint by buying surplus milk until the market price is $1 per pint. Use the accompanying diagram to answer the following questions.
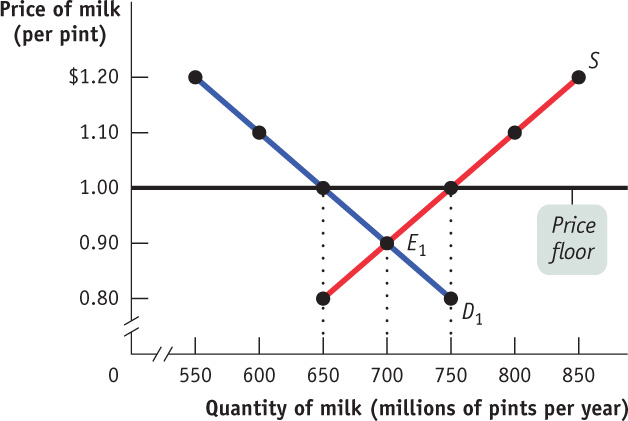
- a. How much surplus milk will be produced as a result of this policy?
- b. What will be the cost to the government of this policy?
- c. Since milk is an important source of protein and calcium, the government decides to provide the surplus milk it purchases to elementary schools at a price of only $0.60 per pint. Assume that schools will buy any amount of milk available at this low price. But parents now reduce their purchases of milk at any price by 50 million pints per year because they know their children are getting milk at school. How much will the dairy program now cost the government?
- d. Give two examples of inefficiencies arising from wasted resources that are likely to result from this policy. What is the missed opportunity in each case?
4.European governments tend to make greater use of price controls than the U.S. government. For example, the French government sets minimum starting yearly wages for new hires who have completed le bac, certification roughly equivalent to a high school diploma. The demand schedule for new hires with le bac and the supply schedule for similarly credentialed new job seekers are given in the accompanying table. The price here—
| Wage (per year) |
Quantity demanded (new job offers per year) |
Quantity supplied (new job seekers per year) |
|---|---|---|
| €45,000 | 200,000 | 325,000 |
| 40,000 | 220,000 | 320,000 |
| 35,000 | 250,000 | 310,000 |
| 30,000 | 290,000 | 290,000 |
| 25,000 | 370,000 | 200,000 |
- a. In the absence of government interference, what is the equilibrium wage and number of graduates hired per year? Illustrate with a diagram. Will there be anyone seeking a job at the equilibrium wage who is unable to find one—
that is, will there be anyone who is involuntarily unemployed? - b. Suppose the French government sets a minimum yearly wage of 35,000 euros. Is there any involuntary unemployment at this wage? If so, how much? Illustrate with a diagram. What if the minimum wage is set at 40,000 euros? Also illustrate with a diagram.
- c. Given your answer to part b and the information in the table, what do you think is the relationship between the level of involuntary unemployment and the level of the minimum wage? Who benefits from such a policy? Who loses? What is the missed opportunity here?
5.Until recently, the standard number of hours worked per week for a full-
6.The waters off the north Atlantic coast were once teeming with fish. Now, due to overfishing by the commercial fishing industry, the stocks of fish are seriously depleted. In 1991, the National Marine Fishery Service of the U.S. government implemented a quota to allow fish stocks to recover. The quota limited the amount of swordfish caught per year by all U.S.-licensed fishing boats to 7 million pounds. As soon as the U.S. fishing fleet had met the quota, the swordfish catch was closed down for the rest of the year. The accompanying table gives the hypothetical demand and supply schedules for swordfish caught in the United States per year.
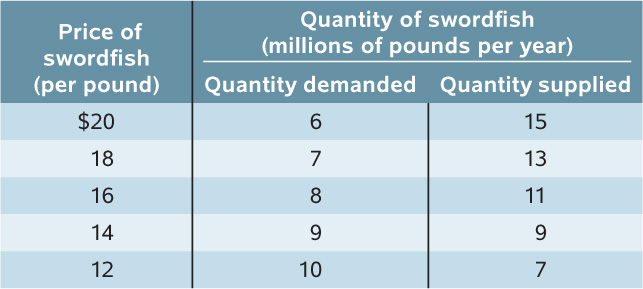
- a. Use a diagram to show the effect of the quota on the market for swordfish in 1991.
- b. How do you think fishermen will change how they fish in response to this policy?
7.Consider the original market for pizza in Collegetown, illustrated in the accompanying table. Collegetown officials decide to impose an excise tax on pizza of $4 per pizza.
| Price of pizza | Quantity of pizza demanded | Quantity of pizza supplied |
|---|---|---|
| 10 | 0 | 6 |
| 9 | 1 | 5 |
| 8 | 2 | 4 |
| 7 | 3 | 3 |
| 6 | 4 | 2 |
| 5 | 5 | 1 |
| 4 | 6 | 0 |
| 3 | 7 | 0 |
| 2 | 8 | 0 |
| 1 | 9 | 0 |
- a. What is the quantity of pizza bought and sold after the imposition of the tax? What is the price paid by consumers? What is the price received by producers?
- b. Calculate the consumer surplus and the producer surplus after the imposition of the tax. By how much has the imposition of the tax reduced consumer surplus? By how much has it reduced producer surplus?
- c. How much tax revenue does Collegetown earn from this tax?
- d. Calculate the deadweight loss from this tax.
8.The state needs to raise money, and the governor has a choice of imposing an excise tax of the same amount on one of two previously untaxed goods: either restaurant meals or gasoline. Both the demand for and the supply of restaurant meals are more elastic than the demand for and the supply of gasoline. If the governor wants to minimize the deadweight loss caused by the tax, which good should be taxed? For each good, draw a diagram that illustrates the deadweight loss from taxation.
9.The U.S. government would like to help the American auto industry compete against foreign automakers that sell trucks in the United States. It can do this by imposing an excise tax on each foreign truck sold in the United States. The hypothetical pre-
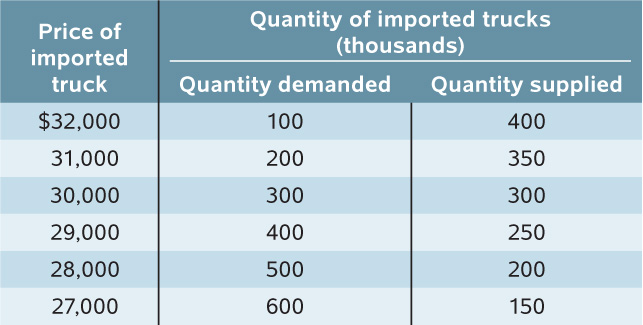
- a. In the absence of government interference, what is the equilibrium price of an imported truck? The equilibrium quantity? Illustrate with a diagram.
- b. Assume that the government imposes an excise tax of $3,000 per imported truck. Illustrate the effect of this excise tax in your diagram from part a. How many imported trucks are now purchased and at what price? How much does the foreign automaker receive per truck?
- c. Calculate the government revenue raised by the excise tax in part b. Illustrate it on your diagram.
- d. How does the excise tax on imported trucks benefit American automakers? Whom does it hurt? How does inefficiency arise from this government policy?
10.In 1990, the United States began to levy a tax on sales of luxury cars. For simplicity, assume that the tax was an excise tax of $6,000 per car. The accompanying figure shows hypothetical demand and supply curves for luxury cars.
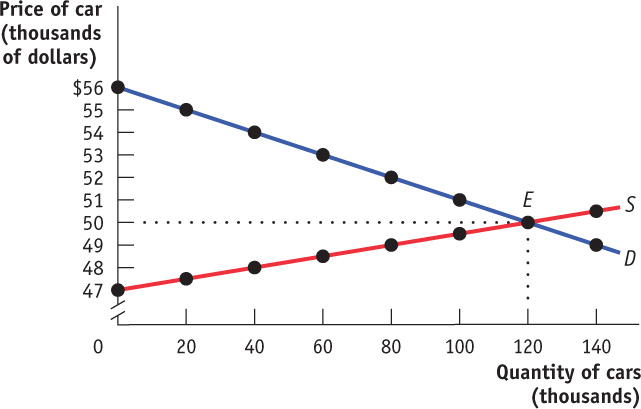
- a. Under the tax, what is the price paid by consumers? What is the price received by producers? What is the government tax revenue from the excise tax? Over time, the tax on luxury automobiles was slowly phased out (and completely eliminated in 2002). Suppose that the excise tax falls from $6,000 per car to $4,500 per car.
- b. After the reduction in the excise tax from $6,000 to $4,500 per car, what is the price paid by consumers? What is the price received by producers? What is tax revenue now?
- c. Compare the tax revenue created by the taxes in parts a and b. What accounts for the change in tax revenue from the reduction in the excise tax?
11.All states impose excise taxes on gasoline. According to data from the Federal Highway Administration, one year the state of California imposed an excise tax of $0.18 per gallon of gasoline. That same year, gasoline sales in California totaled 14.8 billion gallons. What was California’s tax revenue from the gasoline excise tax? If California doubled the excise tax, would tax revenue double? Why or why not?
12.In each of the following cases involving taxes, explain: (i) whether the incidence of the tax falls more heavily on consumers or producers, (ii) why government revenue raised from the tax is not a good indicator of the true cost of the tax, and (iii) how deadweight loss arises as a result of the tax.
- a. The government imposes an excise tax on the sale of all college textbooks. Before the tax was imposed, 1 million textbooks were sold every year at a price of $50. After the tax is imposed, 600,000 books are sold yearly; students pay $55 per book, $30 of which publishers receive.
- b. The government imposes an excise tax on the sale of all airline tickets. Before the tax was imposed, 3 million airline tickets were sold every year at a price of $500. After the tax is imposed, 1.5 million tickets are sold yearly; travelers pay $550 per ticket, $450 of which the airlines receive.
- c. The government imposes an excise tax on the sale of all toothbrushes. Before the tax, 2 million toothbrushes were sold every year at a price of $1.50. After the tax is imposed, 800,000 toothbrushes are sold every year; consumers pay $2 per toothbrush, $1.25 of which producers receive.
