Problems
1.Changes in the prices of key commodities can have a significant impact on a company’s bottom line. According to an article in the Wall Street Journal, “Now, with oil, gas and electricity prices soaring, companies are beginning to realize that saving energy can translate into dramatically lower costs.” Another Wall Street Journal article states, “Higher grain prices are taking an increasing financial toll.” Energy is an input into virtually all types of production; corn is an input into the production of beef, chicken, high-
- a. Explain how the cost of energy can be both a fixed cost and a variable cost for a company.
- b. Suppose energy is a fixed cost and energy prices rise. What happens to the company’s average total cost curve? What happens to its marginal cost curve? Illustrate your answer with a diagram.
- c. Explain why the cost of corn is a variable cost but not a fixed cost for an ethanol producer.
- d. When the cost of corn goes up, what happens to the average total cost curve of an ethanol producer? What happens to its marginal cost curve? Illustrate your answer with a diagram.
2.Marty’s Frozen Yogurt is a small shop that sells cups of frozen yogurt in a university town. Marty owns three frozen-
| Quantity of labor (workers) | Quantity of frozen yogurt (cups) |
|---|---|
| 0 | 0 |
| 1 | 110 |
| 2 | 200 |
| 3 | 270 |
| 4 | 300 |
| 5 | 320 |
| 6 | 330 |
- a. What are the fixed inputs and variable inputs in the production of cups of frozen yogurt?
- b. Draw the total product curve. Put the quantity of labor on the horizontal axis and the quantity of frozen yogurt on the vertical axis.
- c. What is the marginal product of the first worker? The second worker? The third worker? Why does marginal product decline as the number of workers increases?
3.The production function for Marty’s Frozen Yogurt is given in Problem 2. Marty pays each of his workers $80 per day. The cost of his other variable inputs is $0.50 per cup of yogurt. His fixed cost is $100 per day.
- a. What is Marty’s variable cost and total cost when he produces 110 cups of yogurt? 200 cups? Calculate variable and total cost for every level of output given in Problem 2.
- b. Draw Marty’s variable cost curve. On the same diagram, draw his total cost curve.
- c. What is the marginal cost per cup for the first 110 cups of yogurt? For the next 90 cups? Calculate the marginal cost for all remaining levels of output.
4.The production function for Marty’s Frozen Yogurt is given in Problem 2. The costs are given in Problem 3.
- a. For each of the given levels of output, calculate the average fixed cost (AFC), average variable cost (AVC), and average total cost (ATC) per cup of frozen yogurt.
- b. On one diagram, draw the AFC, AVC, and ATC curves.
- c. What principle explains why the AFC declines as output increases? What principle explains why the AVC increases as output increases? Explain your answers.
- d. How many cups of frozen yogurt are produced when average total cost is minimized?
5.The accompanying table shows a car manufacturer’s total cost of producing cars.
| Quantity of cars | TC |
|---|---|
| 0 | $500,000 |
| 1 | 540,000 |
| 2 | 560,000 |
| 3 | 570,000 |
| 4 | 590,000 |
| 5 | 620,000 |
| 6 | 660,000 |
| 7 | 720,000 |
| 8 | 800,000 |
| 9 | 920,000 |
| 10 | 1,100,000 |
- a. What is this manufacturer’s fixed cost?
- b. For each level of output, calculate the variable cost (VC). For each level of output except zero, calculate the average variable cost (AVC), average total cost (ATC), and average fixed cost (AFC). What is the minimum-
cost output? - c. For each level of output, calculate this manufacturer’s marginal cost (MC).
- d. On one diagram, draw the manufacturer’s AVC, ATC, and MC curves.
6.Labor costs represent a large percentage of total costs for many firms. Assume that in September 2013 U.S. labor costs were up 0.9% during the preceding three months and 0.8% over the three months preceding those.
- a. When labor costs increase, what happens to average total cost and marginal cost? Consider a case in which labor costs are only variable costs and a case in which they are both variable and fixed costs.
An increase in labor productivity means each worker can produce more output. Recent data on productivity show that labor productivity in the U.S. nonfarm business sector grew 2% for each of the years 2011, 2012, and 2013. Annual growth in labor productivity averaged 1.5% from the mid-1970s to mid- 1990s, 2.6% in the past decade, and 4% for a couple of years in the early 2000s. - b. When productivity growth is positive, what happens to the total product curve and the marginal product of labor curve? Illustrate your answer with a diagram.
- c. When productivity growth is positive, what happens to the marginal cost curve and the average total cost curve? Illustrate your answer with a diagram.
- d. If labor costs are rising over time on average, why would a company want to adopt equipment and methods that increase labor productivity?
7.Magnificent Blooms is a florist specializing in floral arrangements for weddings, graduations, and other events. The firm has a fixed cost associated with space and equipment of $100 per day. Each worker is paid $50 per day. The daily production function for Magnificent Blooms is shown in the accompanying table.
| Quantity of labor (workers) | Quantity of floral arrangements |
|---|---|
| 0 | 0 |
| 1 | 5 |
| 2 | 9 |
| 3 | 12 |
| 4 | 14 |
| 5 | 15 |
- a. Calculate the marginal product of each worker. What principle explains why the marginal product per worker declines as the number of workers employed increases?
- b. Calculate the marginal cost of each level of output. What principle explains why the marginal cost per floral arrangement increases as the number of arrangements increases?
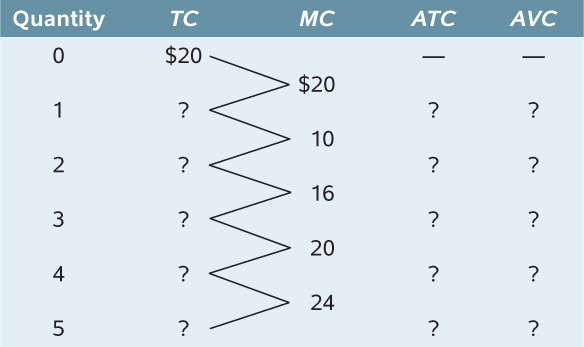
8.You have the information shown in the accompanying table about a firm’s costs. Complete the missing data.
9.Evaluate each of the following statements. If a statement is true, explain why; if it is false, identify the mistake and try to correct it.
- a. A decreasing marginal product tells us that marginal cost must be rising.
- b. An increase in fixed cost increases the minimum-
cost output. - c. An increase in fixed cost increases marginal cost.
- d. When marginal cost is above average total cost, average total cost must be falling.
10.Mark and Jeff operate a small company that produces souvenir footballs. Their fixed cost is $2,000 per month. They can hire workers for $1,000 per worker per month. Their monthly production function for footballs is as given in the accompanying table.
| Quantity of labor (workers) | Quantity of footballs |
|---|---|
| 0 | 0 |
| 1 | 300 |
| 2 | 800 |
| 3 | 1,200 |
| 4 | 1,400 |
| 5 | 1,500 |
- a. For each quantity of labor, calculate average variable cost (AVC), average fixed cost (AFC), average total cost (ATC), and marginal cost (MC).
- b. On one diagram, draw the AVC, ATC, and MC curves.
- c. At what level of output is Mark and Jeff’s average total cost minimized?
11.You produce widgets. Currently you produce four widgets at a total cost of $40.
- a. What is your average total cost?
- b. Suppose you could produce one more (the fifth) widget at a marginal cost of $5. If you do produce that fifth widget, what will your average total cost be? Has your average total cost increased or decreased? Why?
- c. Suppose instead that you could produce one more (the fifth) widget at a marginal cost of $20. If you do produce that fifth widget, what will your average total cost be? Has your average total cost increased or decreased? Why?
