How Changing Prices Affect Consumer Surplus
It is often important to know how much consumer surplus changes when the price changes. For example, we may want to know how much consumers are hurt if a flood in cotton-
Let’s return to the example of the market for used textbooks. Suppose that the bookstore decided to sell used textbooks for $20 instead of $30. How much would this fall in price increase consumer surplus?
The answer is illustrated in Figure 4-4. As shown in the figure, there are two parts to the increase in consumer surplus. The first part, shaded dark blue, is the gain of those who would have bought books even at the higher price of $30. Each of the students who would have bought books at $30—
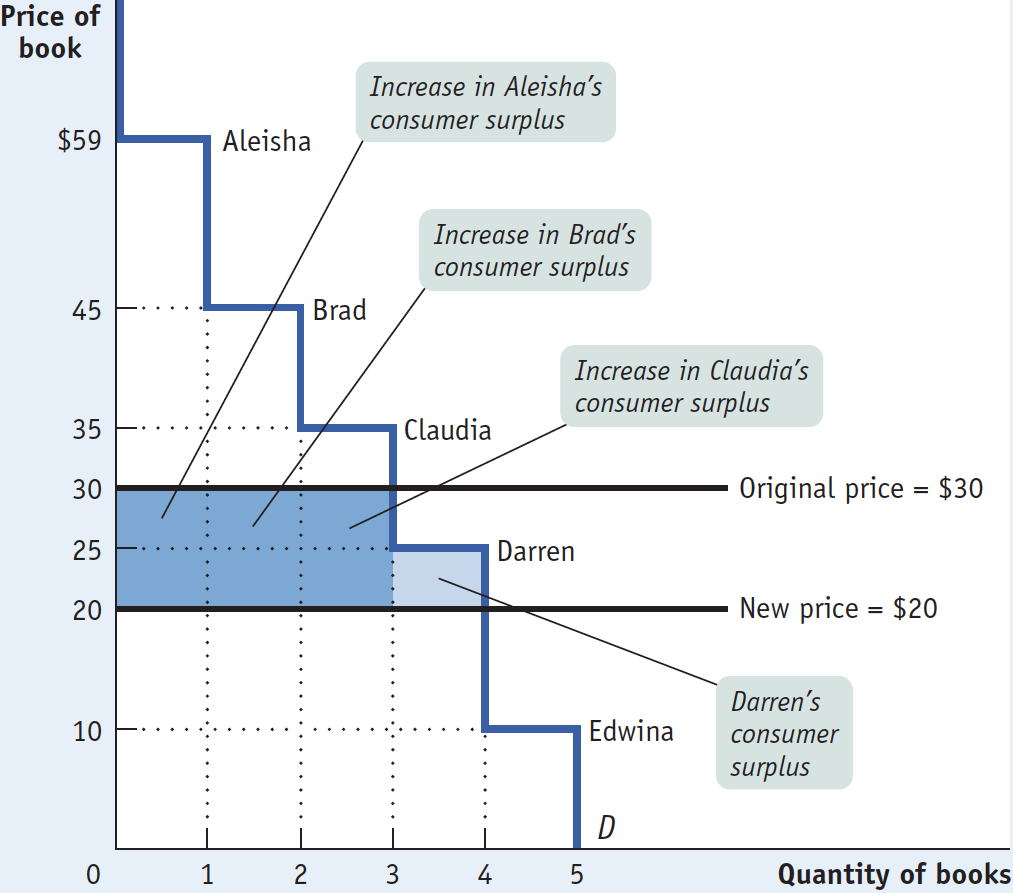
The second part, shaded light blue, is the gain to those who would not have bought a book at $30 but are willing to pay more than $20. In this case that gain goes to Darren, who would not have bought a book at $30 but does buy one at $20. He gains $5—
The total increase in consumer surplus is the sum of the shaded areas, $35. Likewise, a rise in price from $20 to $30 would decrease consumer surplus by an amount equal to the sum of the shaded areas.
Figure 4-4 illustrates that when the price of a good falls, the area under the demand curve but above the price—
As in the used-
As before, the total gain in consumer surplus is the sum of the shaded areas: the increase in the area under the demand curve but above the price.
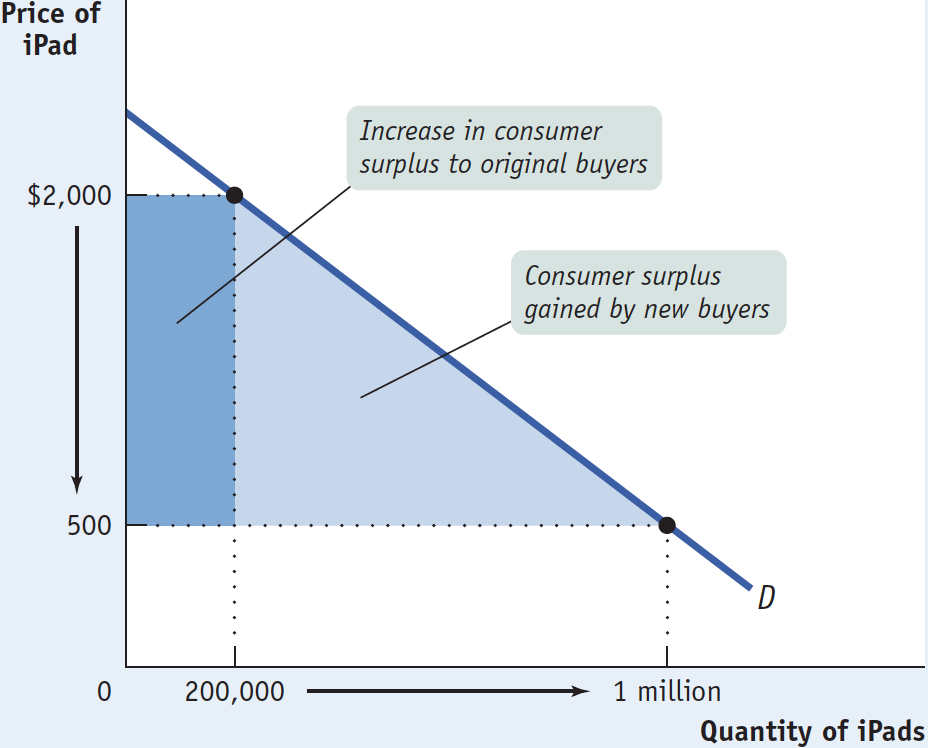
What would happen if the price of a good were to rise instead of fall? We would do the same analysis in reverse. Suppose, for example, that for some reason the price of iPads rises from $500 to $2,000. This would lead to a fall in consumer surplus, equal to the sum of the shaded areas in Figure 4-5. This loss consists of two parts. The dark blue rectangle represents the loss to consumers who would still buy an iPad, even at a price of $2,000. The light blue triangle represents the loss to consumers who decide not to buy an iPad at the higher price.
FOR INQUIRING MINDS: A Matter of Life and Death
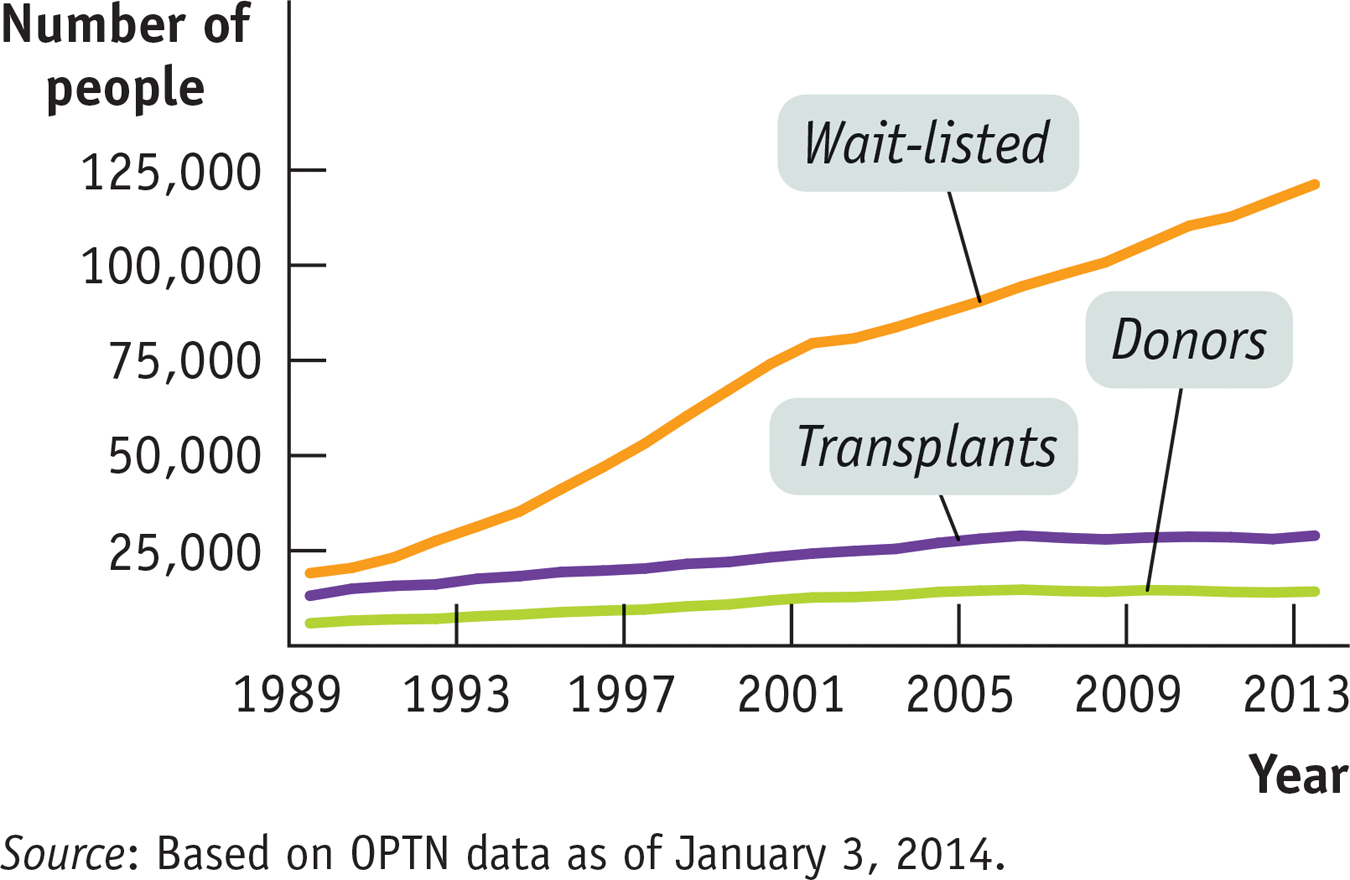
In 2013, more than 6,500 Americans died because of a shortage of organs for transplant. As of 2014, more than 122,000 were wait-
Since the number of those who need an organ far exceeds availability, what is the best way to allocate the available organs? A market isn’t feasible. And for understandable reasons, the sale of human body parts is illegal in this country. So the task for establishing a protocol for these situations has fallen to the nonprofit group United Network for Organ Sharing (UNOS).
Kidney transplants, the most common type of organ transplant, were the focus of attention when UNOS decided to reformulate its protocol for allocating organs to transplant recipients. Under previous guidelines, a donated kidney would go to the person who had been waiting the longest. According to this system, an available kidney would go to a 75-
To address this issue, in 2013 UNOS adopted a new set of guidelines based on a concept it calls “net survival benefit.” Kidneys are ranked according to how long they are likely to last; similarly, recipients are ranked according to how long they are likely to live once receiving a transplanted kidney. Then, under the new guidelines, a kidney is matched to the recipient expected to achieve the greatest survival time from that kidney. In other words, a kidney expected to last many decades will be allocated to a relatively younger person, while older recipients will receive kidneys expected to last a fewer number of years.
By matching the expected life span of a kidney to the expected life span of the recipient following the transplant, the new UNOS guideline tries to avert situations in which (1) a recipient outlives the transplanted kidney, requiring yet another transplant and reducing the number of kidneys available to others; or (2) a kidney significantly outlives its recipient, thereby wasting years of kidney function that could have benefited someone else.
So what does all this have to do with consumer surplus? As you may have guessed, the UNOS concept of “net survival benefit” is a lot like individual consumer surplus—
!worldview! ECONOMICS in Action: When Money Isn’t Enough
When Money Isn’t Enough
The key insight we get from the concept of consumer surplus is that purchases yield a net benefit to the consumer because the consumer typically pays a price less than his or her willingness to pay for the good. Another way to say this is that the right to buy a good at the going price is a valuable thing in itself.
Most of the time we don’t think about the value associated with the right to buy a good. In a market economy we take it for granted that we can buy whatever we want, as long as we are willing to pay the market price.
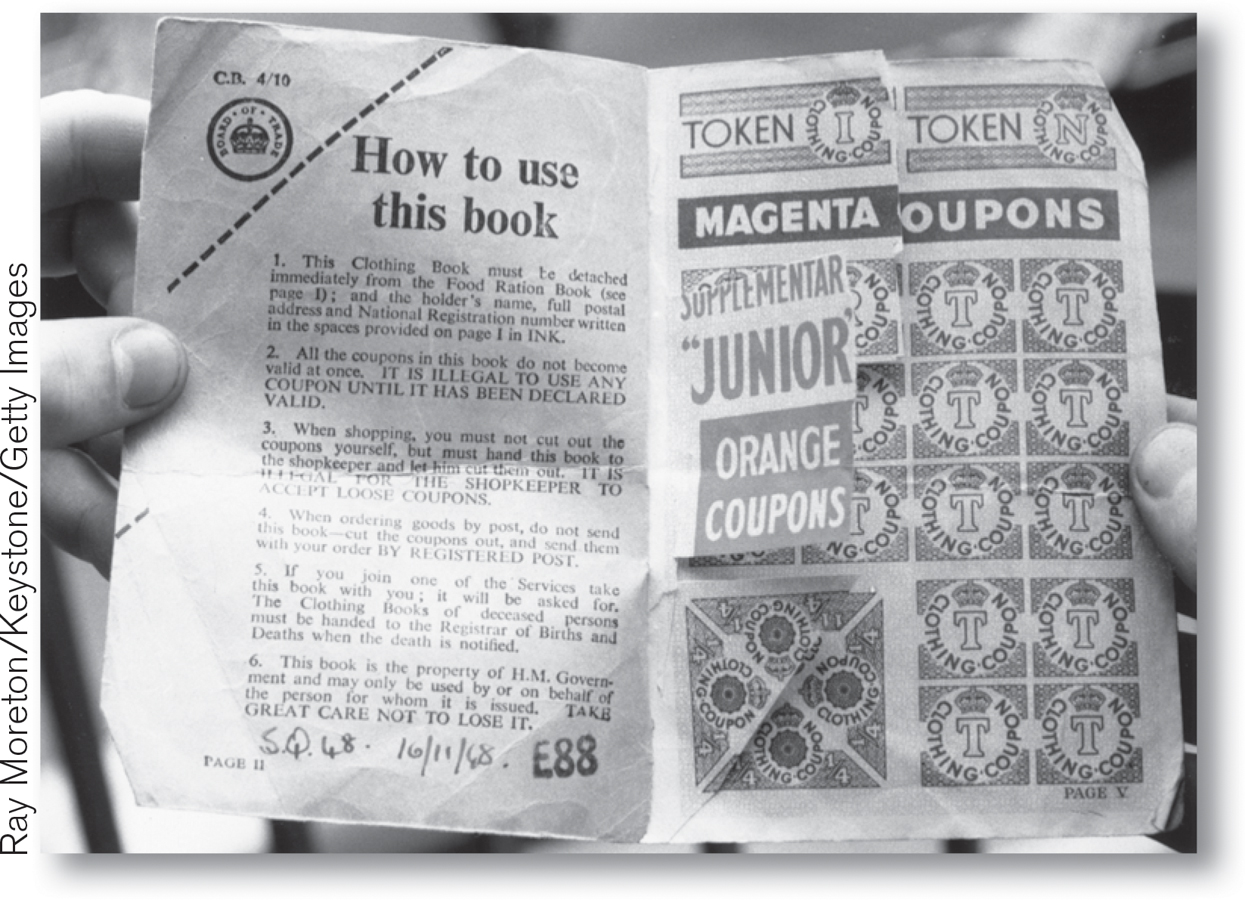
But that hasn’t always been true. For example, during World War II the demands of wartime production created shortages of consumer goods when these goods were sold at prewar prices. Rather than allow prices to rise, government officials in many countries created a system of rationing. To buy sugar, meat, coffee, gasoline, and many other goods, you not only had to pay cash; you also had to present stamps or coupons from books issued to each family by the government. These pieces of paper, which represented the right to buy goods at the government-
As a result, illegal markets in meat stamps and gasoline coupons sprang into existence. Moreover, criminals began stealing coupons and even counterfeiting stamps.
The funny thing was that even if you had bought a gasoline coupon on the illegal market, you still had to pay to purchase gasoline. So what you were buying on the illegal market was not the good but the right to buy the good at the government-
Quick Review
The demand curve for a good is determined by each potential consumer’s willingness to pay.
Individual consumer surplus is the net gain an individual consumer gets from buying a good.
The total consumer surplus in a given market is equal to the area below the market demand curve but above the price.
A fall in the price of a good increases consumer surplus through two channels: a gain to consumers who would have bought at the original price and a gain to consumers who are persuaded to buy by the lower price. A rise in the price of a good reduces consumer surplus in a similar fashion.
4-1
Question 4.1
Consider the market for cheese-
stuffed jalapeno peppers. There are two consumers, Casey and Josey, and their willingness to pay for each pepper is given in the accompanying table. (Neither is willing to consume more than 4 peppers at any price.) Use the table (i) to construct the demand schedule for peppers for prices of $0.00, $0.10, and so on, up to $0.90, and (ii) to calculate the total consumer surplus when the price of a pepper is $0.40. Quantity of peppers
Casey’s willingness to pay
Josey’s willingness to pay
1st pepper
$0.90
$0.80
2nd pepper
0.70
0.60
3rd pepper
0.50
0.40
4th pepper
0.30
0.30
Solutions appear at back of book.