The Effects of Imports
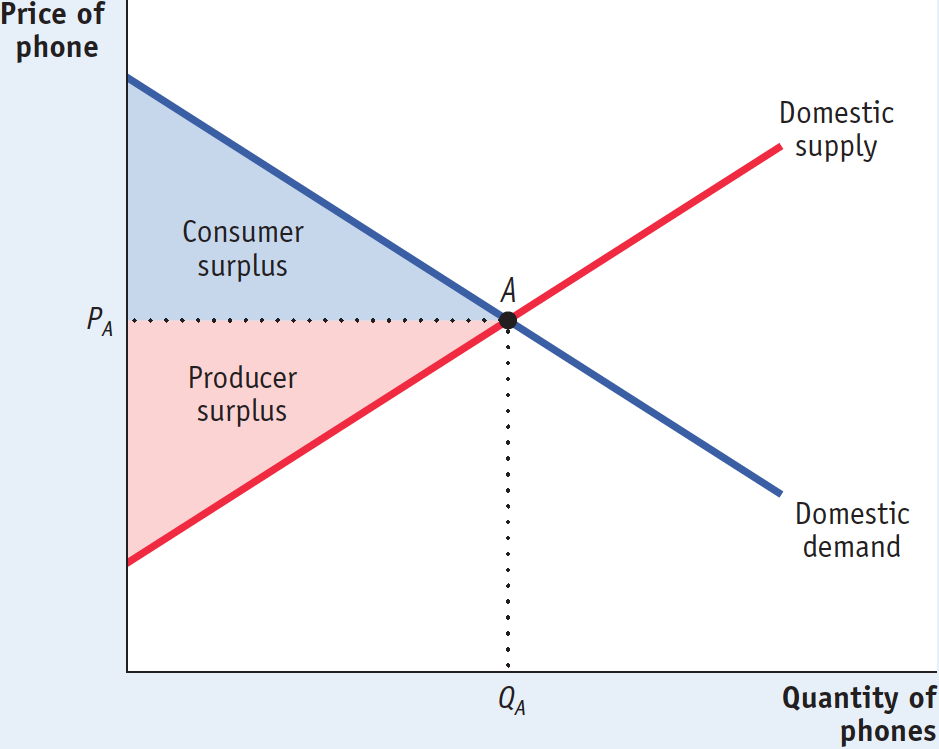
Figure 8-5 shows the U.S. market for phones, ignoring international trade for a moment. It introduces a few new concepts: the domestic demand curve, the domestic supply curve, and the domestic or autarky price.
8-5
Consumer and Producer Surplus in Autarky

The domestic demand curve shows how the quantity of a good demanded by domestic consumers depends on the price of that good.
The domestic demand curve shows how the quantity of a good demanded by residents of a country depends on the price of that good. Why “domestic”? Because people living in other countries may demand the good, too. Once we introduce international trade, we need to distinguish between purchases of a good by domestic consumers and purchases by foreign consumers. So the domestic demand curve reflects only the demand of residents of our own country.
The domestic supply curve shows how the quantity of a good supplied by domestic producers depends on the price of that good.
Similarly, the domestic supply curve shows how the quantity of a good supplied by producers inside our own country depends on the price of that good. Once we introduce international trade, we need to distinguish between the supply of domestic producers and foreign supply—
In autarky, with no international trade in phones, the equilibrium in this market would be determined by the intersection of the domestic demand and domestic supply curves, point A. The equilibrium price of phones would be PA, and the equilibrium quantity of phones produced and consumed would be QA. As always, both consumers and producers gain from the existence of the domestic market. In autarky, consumer surplus would be equal to the area of the blue-
The world price of a good is the price at which that good can be bought or sold abroad.
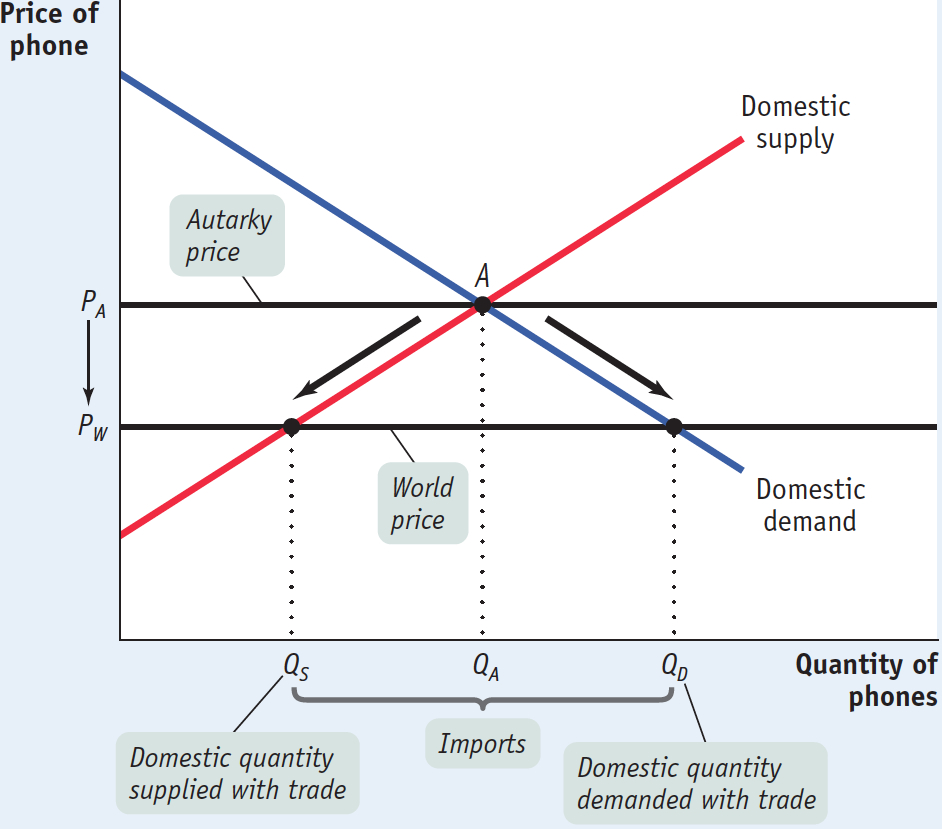
Now let’s imagine opening up this market to imports. To do this, we must make an assumption about the supply of imports. The simplest assumption, which we will adopt here, is that unlimited quantities of phones can be purchased from abroad at a fixed price, known as the world price of phones. Figure 8-6 shows a situation in which the world price of a phone, PW, is lower than the price of a phone that would prevail in the domestic market in autarky, PA.
8-6
The Domestic Market with Imports

Given that the world price is below the domestic price of a phone, it is profitable for importers to buy phones abroad and resell them domestically. The imported phones increase the supply of phones in the domestic market, driving down the domestic market price. Phones will continue to be imported until the domestic price falls to a level equal to the world price.
The result is shown in Figure 8-6. Because of imports, the domestic price of a phone falls from PA to PW. The quantity of phones demanded by domestic consumers rises from QA to QD, and the quantity supplied by domestic producers falls from QA to QS. The difference between the domestic quantity demanded and the domestic quantity supplied, QD – QS, is filled by imports.
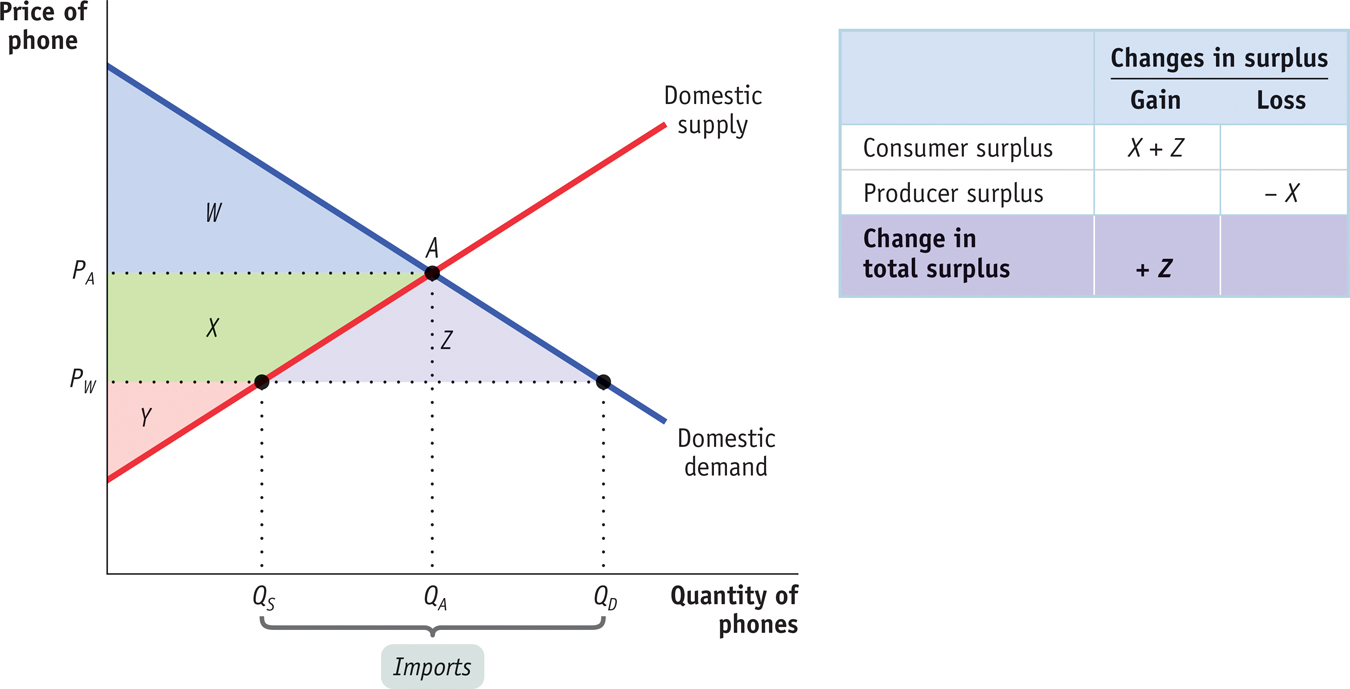
Now let’s turn to the effects of imports on consumer surplus and producer surplus. Because imports of phones lead to a fall in their domestic price, consumer surplus rises and producer surplus falls. Figure 8-7 shows how this works. We label four areas: W, X, Y, and Z. The autarky consumer surplus we identified in Figure 8-5 corresponds to W, and the autarky producer surplus corresponds to the sum of X and Y. The fall in the domestic price to the world price leads to an increase in consumer surplus; it increases by X and Z, so consumer surplus now equals the sum of W, X, and Z. At the same time, producers lose X in surplus, so producer surplus now equals only Y.
8-7
The Effects of Imports on Surplus

The table in Figure 8-7 summarizes the changes in consumer and producer surplus when the phone market is opened to imports. Consumers gain surplus equal to the areas X + Z. Producers lose surplus equal to X. So the sum of producer and consumer surplus—
However, we have also learned that although the country as a whole gains, some groups—
We turn next to the case in which a country exports a good.