Chapter 1. Case Study on Enzyme Inhibition: A Likely Story
1.1 Introduction
Case Study on Enzyme Inhibition: A Likely Story
By Justin Hines, Lafayette College and Marcy Osgood, University of New Mexico
with special thanks to Rose Bayer, Daniel Beideman, and Eugene Warnick.
Popup content goes in this box
New box content
Instructor's Notes
Topic Pre-requisites: Students should have exposure to the topics of Sections 6.1–6.3 in Lehninger POB, 6th ed. In particular, it is important to discuss mechanisms of reversible inhibition, irreversible inhibition, Lineweaver-Burk plots, and how to calculate kcat (if the optional kcat question is assigned).
Case Overview
Students will be given enzyme kinetic data; they will use Microsoft EXCEL (or another graphing program) to graph the data. They will then determine kinetic parameters and type of inhibition and correlate this information to descriptions of molecular mechanisms. Note: This case has two versions that the instructor can choose to assign. These two versions differ only by the inclusion of a question in which students are asked to calculate kcat from experimental data. Instructors should review this question and assign only one version of the case to students.
Students may work individually or in groups to complete this case study. Students are constantly encouraged to refer to their textbook throughout the case, and internet access is permitted, although it is not necessary for the completion of the case. Students are required to iteratively acquire, analyze, and integrate data as they progress through the case and answer assessment questions found throughout the case. All assessments are automatically scored and a tutorial to guide students through using MS EXCEL is provided.
Learning Objectives
This case is intended for remediating or extending student capabilities in these difficult topics:
- Real-world applications of the study of enzyme kinetics. Students should be able to:
- describe the distinctions between kinetic mechanisms of enzyme inhibition.
- use inhibition kinetics to identify inhibitors by kinetic mechanism.
- Connections between molecular mechanism and enzyme kinetics. Students should be able to draw connections and distinctions between molecular binding mechanisms and kinetic mechanisms of inhibitors.
- Practice critical thinking skills involving data. Students should be able to:
- evaluate data from tables.
- create graphical representations of data.
- calculate common kinetic parameters (Vmax, Km and kcat) from data.
Questions designed to show areas of difficulty for students
- Students often struggle with the practical calculation of kcat. This issue will be apparent if students incorrectly answer the optional question about kcat .
- Students may mischaracterize the description of an irreversible inhibitor because they do not know what a stable Schiff-base linkage is. The case provides a teachable moment to point out that the student should learn to recognize when they do not know a term and remedy the problem.
- Students often have difficulty identifying a noncompetitive inhibitor when using real data because real data is not ”perfect”; fit-lines from real data are unlikely to intersect perfectly on the x-axis in a Lineweaver-Burk plot.
- Similar to the issue above, students will often assign mixed inhibition to an uncompetitive inhibitor.
- The example of a lab technician neglecting to properly label samples is, of course, a very common issue in teaching and academic research laboratories. This oversight was inserted in the case study as a teachable moment to remind students to be sure to properly label samples throughout their manipulations when they carry out their own laboratory work.
Suggested implementation
Below we describe two options for course implementation. The hybrid Online/In-class approach is recommended. Time required for students to complete the online case will vary greatly depending on students’ prior experience using MS EXCEL or a similar program. The case study can be started and stopped, and so it is recommended to give students a window of 2 to 3 days in which to complete the assignment.
Hybrid: Online/In-class: (recommended approach; ~30 minutes of class-time expected)
- Share the case study link with your students to work online outside of class. Assign the case study to be due before your next class meeting. Students should be instructed to bring copies of notes, graphs, and calculations to class.
- Review the online answers before the following class for difficult areas for students (see expected areas of student difficulty above).
- Lead students in a discussion in pairs, groups, or as a class (depending upon class size and instructor preference) to address unresolved difficulties (~30 minutes in-class time).
- We recommend that you select questions from the supplied assessment questions to use on exams oras homework assignments to reinforce the difficult concepts covered. Please see the document “Exam Questions for Case 1: Enzyme Inhibition.”
Online only approach: (minimal in-class time required)
- Share the case study link with your students to work online, preferably in pairs or groups of three. Assign the case study to be due before your next class meeting.
- Review the online answers for difficult areas for students (see expected areas of difficulty above).
- Mention or remediate tough points during a portion of lecture.
- We recommend that you select questions from the supplied assessment questions to use on exams oras homework assignments to reinforce the difficult concepts covered. Please see the document “Exam Questions for Case 1: Enzyme Inhibition.”
Suggestions for in-class discussions (these questions may also be used in summative assessments—i.e., exams, scored quizzes, etc.):
- What type of kinetic mechanism would be expected for an irreversible inhibitor and why?
Students could be directed to brainstorm in groups or as a whole class.
- Have students read/view descriptions of inhibitors in the case: ask what specific information in each description is relevant and how it indicates the expected kinetic mechanism.
Could be easily used as a think-pair-share exercise.
- How could an investigator distinguish between a noncompetitive inhibitor and an irreversible inhibitor?
Could be used when students have difficulty with questions 8 and 9 from the online activity.
- Why does Vmax remain unchanged for a competitive inhibitor?
- When calculating kcat, when should you use Etotal and when should you use [Etotal] and why?
Could be used when students have difficulty with optional question 3 from the online activity.
- Why does the measured Km value go down in the presence of an uncompetitive inhibitor?
You are missing vital information
You may be missing vital information needed to sufficiently explain this incident. You must complete all investigations before proceeding to the final assessment questions.
You are missing vital information
You may be missing vital information needed to sufficiently explain this incident. You must complete all investigations before proceeding to the final assessment questions.
1.2 Introduction (continued)
“I’m telling you I didn’t do it!” cried Mrs. Bleu. “He just fell on my knife!” The detective smirked, turning away to hold back a chuckle.
“I don’t know why,” she continued, “he ju—, he… he just sort of turned to me gasping and fell forward... I was just making dinner, chopping broccoli...” Mrs. Bleu trailed off and looked longingly at the floor of the interview room. They had been there for hours. “He was just standing at the end of the kitchen drinking his coffee and looking through the mail when it happened, but it was an accident. Why would I kill my husband?”
“We don’t know why,” the detective said calmly, “we’re hoping you’ll tell us. Your husband was found on the kitchen floor in a pool of blood...his blood. He had a knife wound, a wound from a kitchen knife that was lying on the floor just feet away covered in his blood. His blood…and your fingerprints! Moreover, you told the 911 operator that you stabbed him—“
“Accidentally!” she gasped.
“Ok…ok, you admitted accidentally stabbing him…but do you really expect us to believe that he just fell onto your knife. Do you know how ridiculous that sounds?”
“I don’t care if it sounds ridiculous! It’s what happened!” she said, exasperated. “Look…I need to know what happened to my husband. One minute he was fine, and the next he was gasping! He had a heart attack I think, er—, I don’ t know, but he was MY husband. Why won’t you tell me?”
The detective looked annoyed. “We haven’t heard back yet from the coroner Mrs. Bleu…but this is an active homicide investigation. We will share that information with you when we get it. Believe me, when we get confirmation of the cause of death, we will be talking again…soon.”
He stepped out. He had heard some good ones, but “he fell on my knife”? Really?? At that moment, the coroner stepped off the elevator and into the empty hallway…she was out of breath and appeared to be sweating.
“Frank! Frank, listen! I just finished the autopsy. It missed!”
“What? What missed? Was it homicide?”
“No! I mean, maybe. Er—I don’t know for sure yet, we need the Tox. results.”
“Toxicology results? …for a stabbing? And what do you mean it missed?”
“That’s just it, the knife! It missed the brachial artery! It was only muscle damage, mostly venous bleeding…seeping blood…comes out slow. It was halfway coagulated before he died and wasn’t even that deep.”
“What? Will you just calm down and start talking in plain English! What are you trying to say?”
"It was a flesh wound…plenty of blood, but not enough to kill a person. Without arterial damage it would take a long time to bleed out from this wound. But there is more to it…this guy died shortly after he was stabbed, but it wasn’t from the knife, that much is for sure!”
The detective cursed under his breath…it was going to be a long day. “Okay, so the guy didn’t die from the knife wound, but he is dead, so from what?!!”
1.3 Introduction (continued)
Two weeks have passed and you have been brought in to help investigate this case. You have heard the interrogation tapes and been briefed by both the lead detective and the coroner. The coroner has ruled the cause of death of Dr. John Bleu a homicide, but by poisoning, rather than because of the knife wound inflicted by Mrs. Bleu, presumably now by accident. Small quantities of an unknown substance, hereafter referred to as Compound X, were discovered in the decaf coffee Dr. Bleu was drinking when he died. Dr. Bleu had brought the coffee home with him from work as he did everyday according to co-workers and his wife. His wife is still under suspicion, but it has not escaped the notice of the investigators that Dr. Bleu leads a large research group studying potentially lethal enzyme inhibitors for the drug company Hinesbiopharma.
The company is working with the U.S. government in a counter-terrorism effort to study the effects of chemical weapons so that potential treatments can be created in advance. Three scientists who Dr. Bleu supervised are running independent projects studying different inhibitors toward the same enzyme, referred to in company documents only as XYZase. XYZase is critical to human metabolism, and so development of chemical inhibitors of this enzyme by terrorist groups is viewed as a real and present threat by counter-terrorism experts. The three scientists are Dr. Greene, Dr. Gray, and Dr. Wight. According to the company policies, only Dr. Bleu and the single scientist assigned to each project have access to the highly valuable but extremely lethal compounds each one is studying.
To complete the case, you will need to investigate. You will be given enzyme kinetics data, and you will need to use Microsoft EXCEL (or another graphing program) to graph the data in order to determine the kinetic parameters and the type of inhibition. A tutorial to guide you through using MS EXCEL is also provided.
Tutorials for graphing data on Microsoft Excel 2007/2010
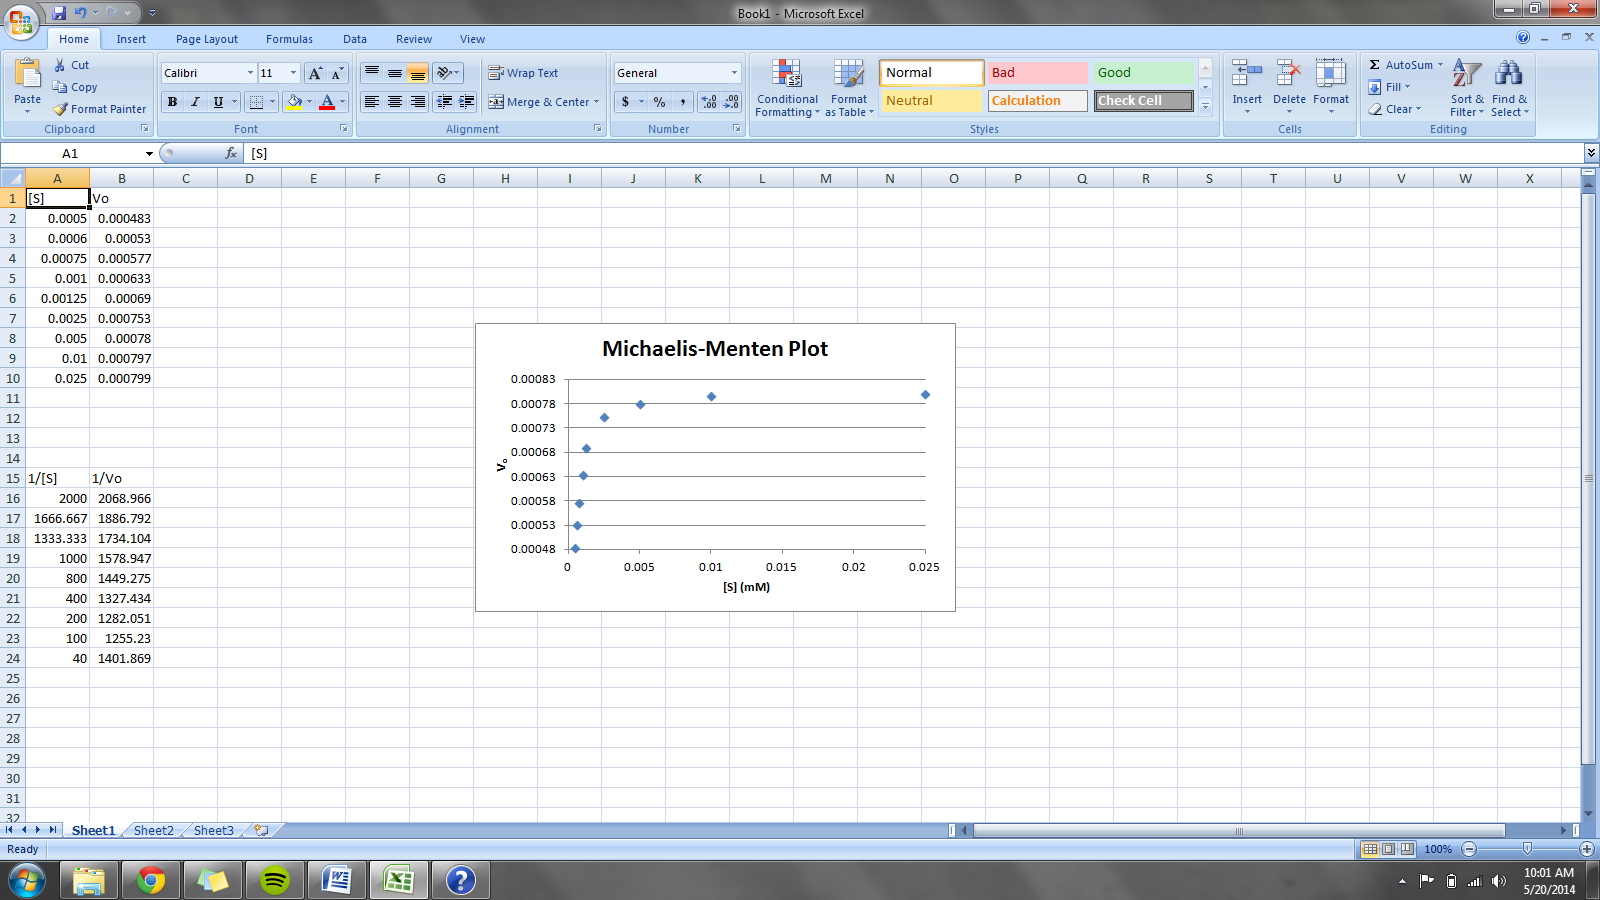
First, enter your data into two columns with your x-variable on the left and your y-variable on the right.

Next, highlight the columns you wish to graph. Go to the ‘Insert’ tab and click the ‘Scatter’ option which will display a drop-down menu. Select ‘Scatter with only Markers.’
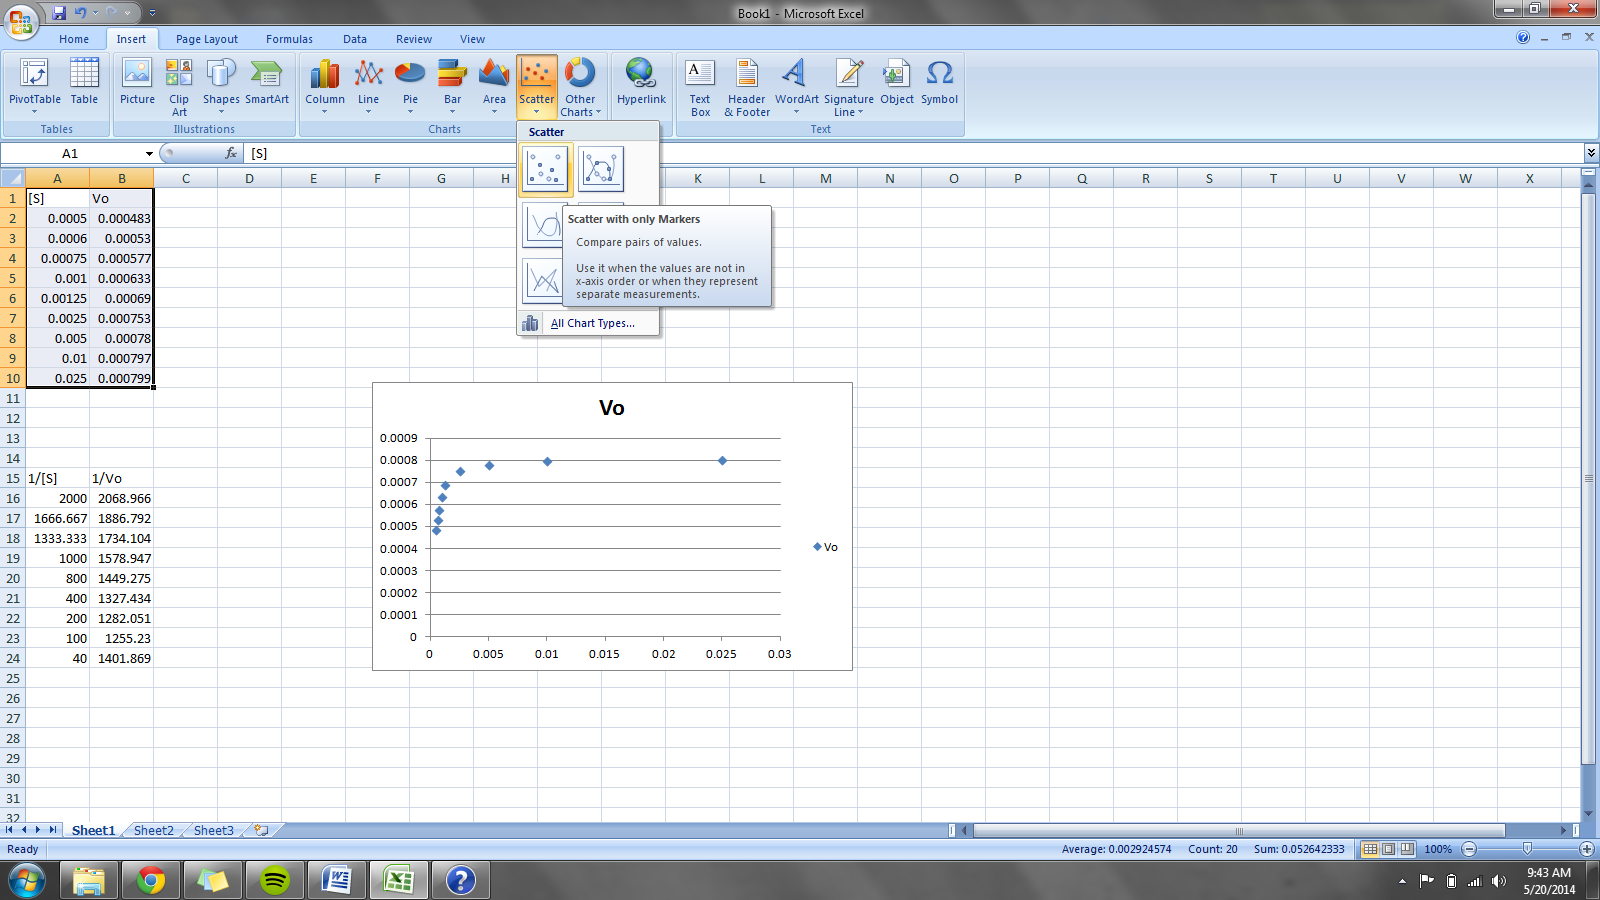
Now, the graph will appear and you can adjust it according to your data. If there is only one set of data on the graph you may choose to delete the legend. Otherwise, left-click on the graph and go to the ‘Layout’ tab at the top of the screen and you can set the graph’s title and axes by selecting ‘Chart Title’ and ‘Axis Titles’ respectively.
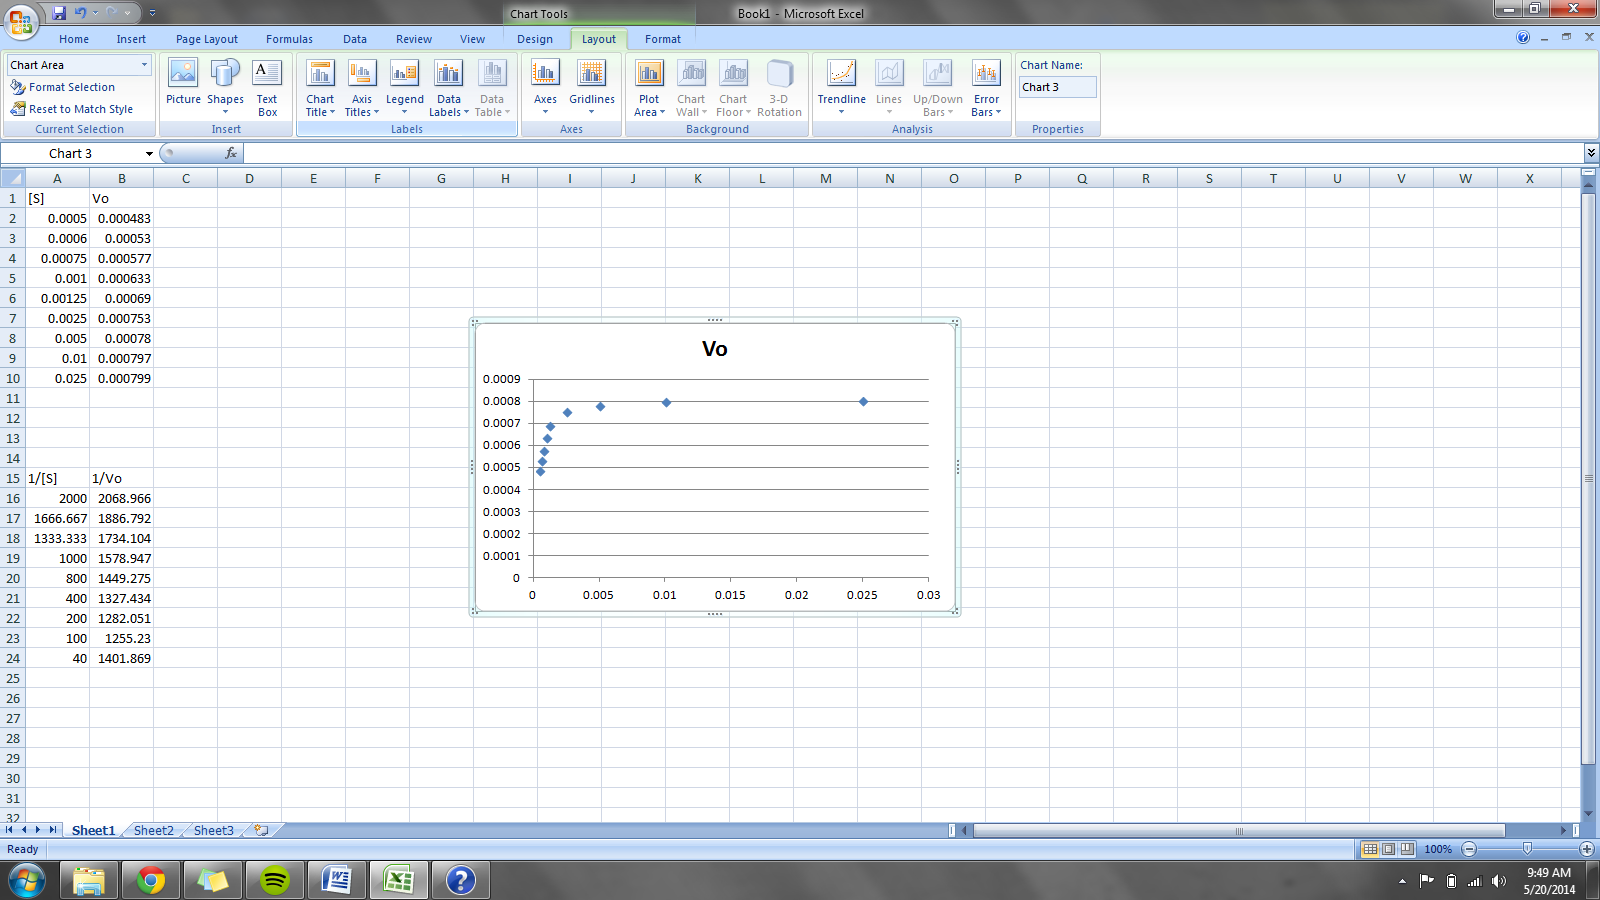
Furthermore, you can adjust the axes to suit your data. To do this, right click on the axis you wish to manipulate and select “format axis”.
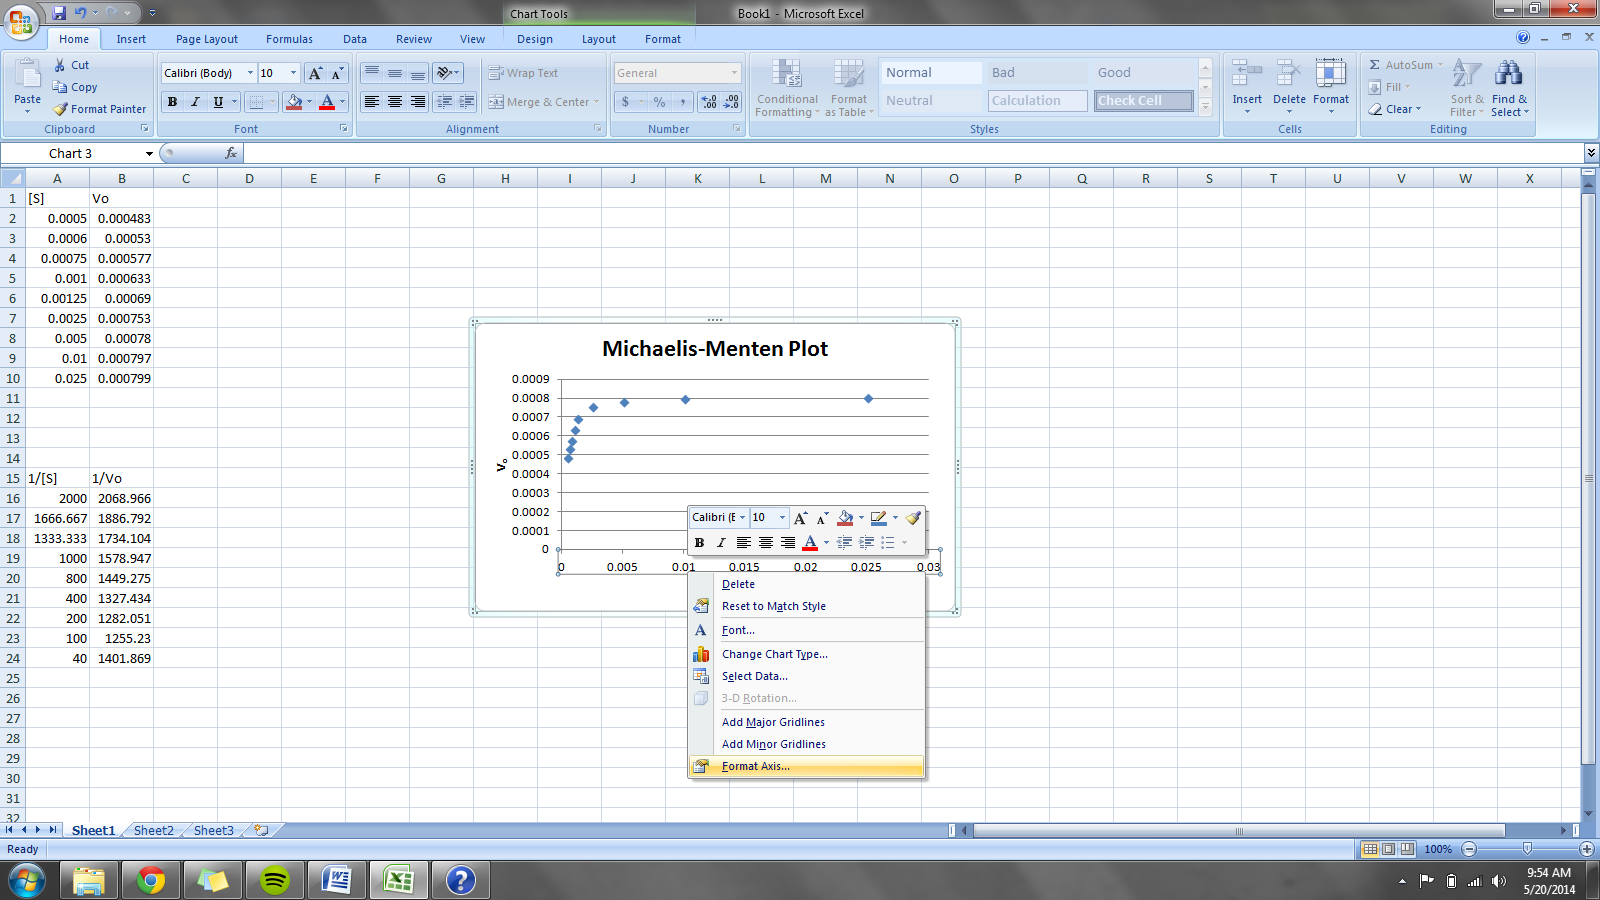
A new screen will appear with all axis options. Select appropriate numbers, with respect to your data, for the maximum and minimum values for both axes.
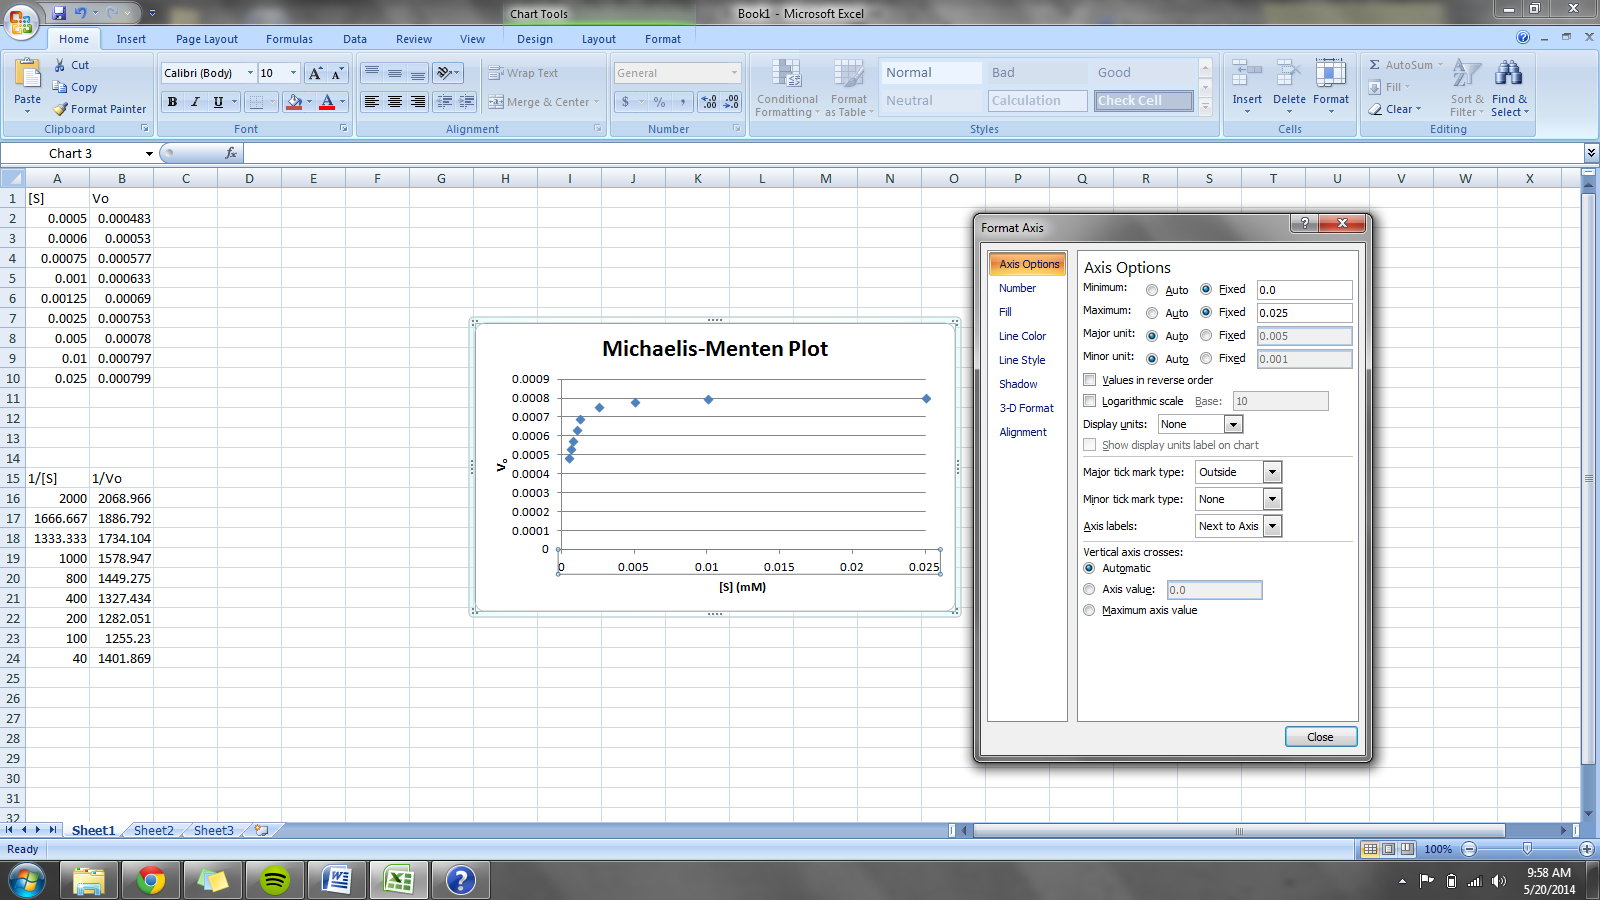
After adjusting your axes you’ve now successfully made a graph of your data in Excel. In this case, the final graph looks like so:
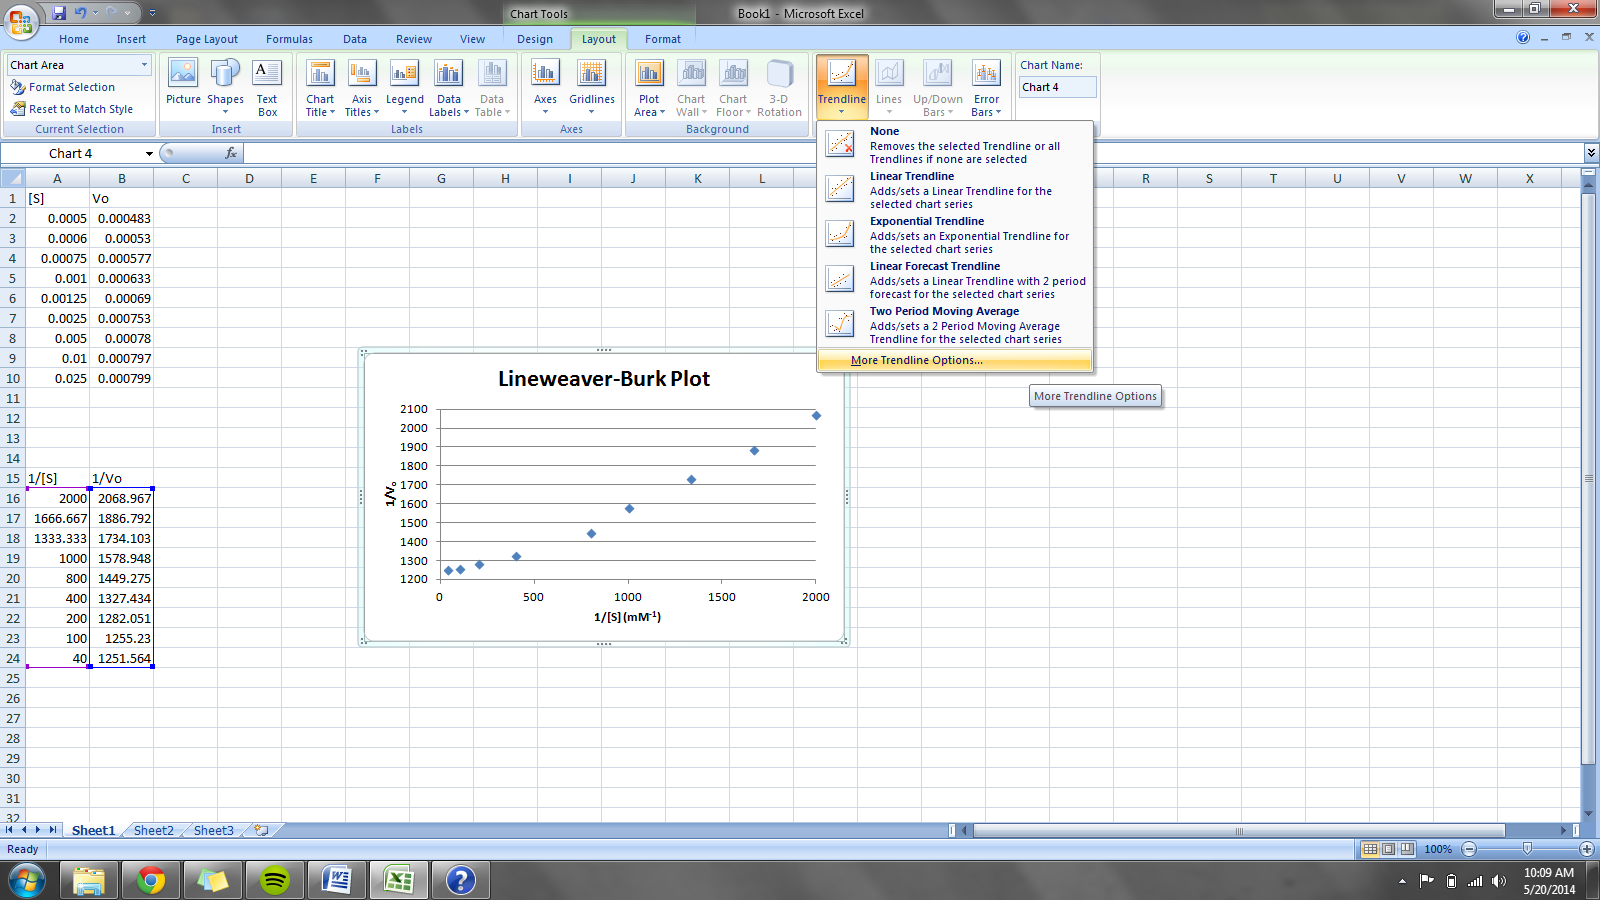
If your data fits a straight-line, you may be interested in the equation. If so, follow all the same steps as before to graph your data then left-click on your graph and go to the ‘Layout’ tab. From here, click the ‘Trendline’ option which will display a drop-down menu and select ‘More Trendline Options.’
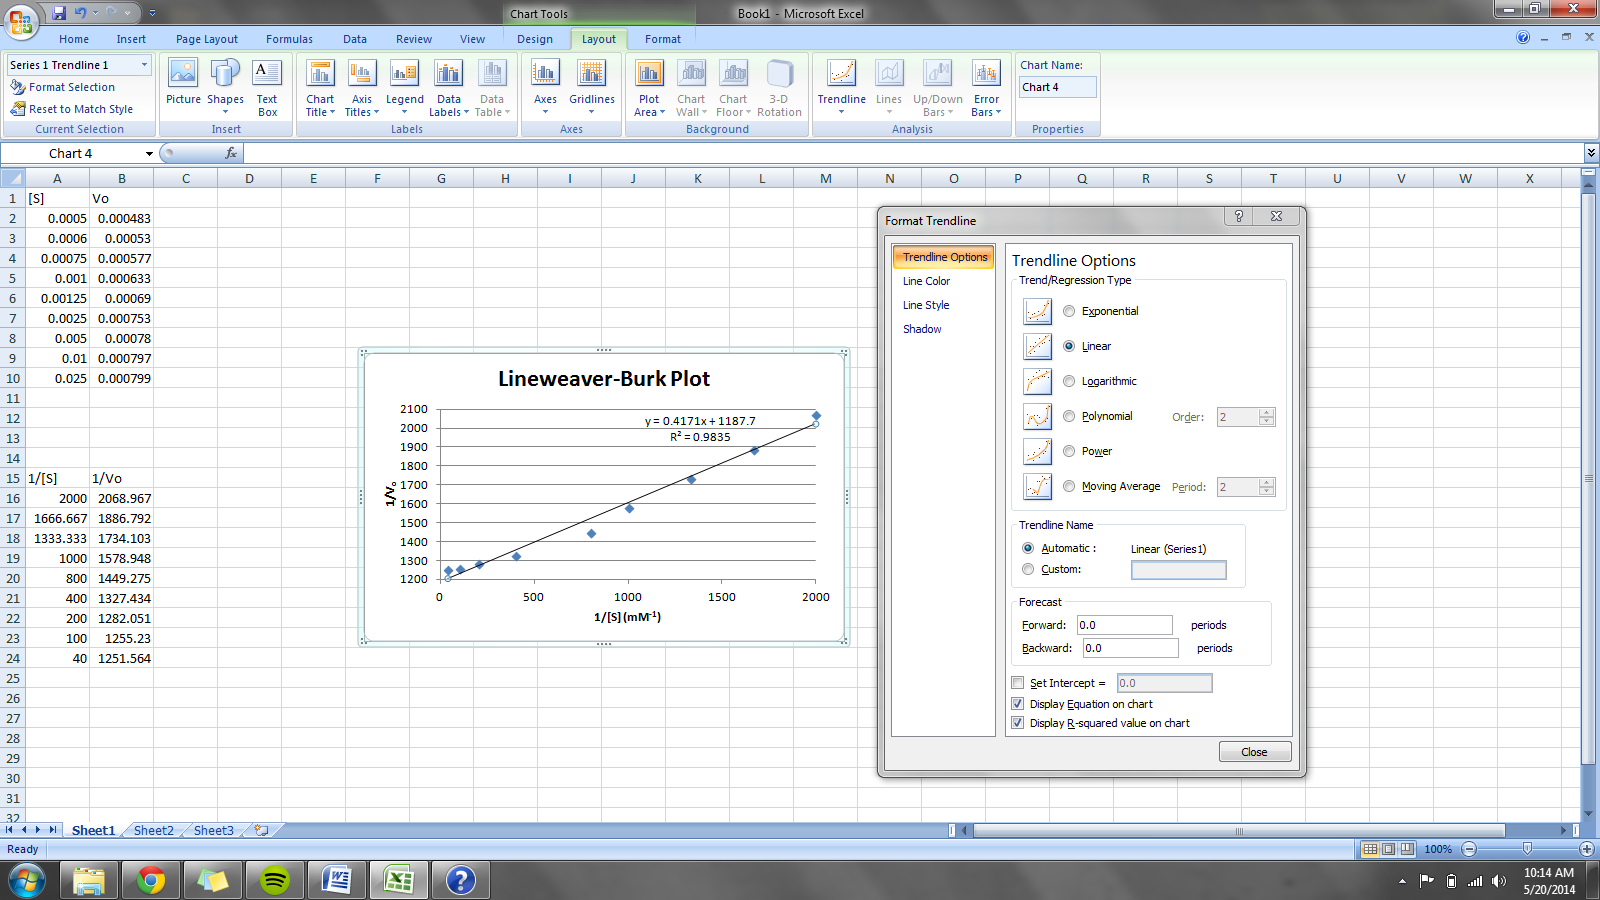
A new screen will appear with all trendline options. Now, you can select the type of fit you would like to do in addition to displaying the equation and R2 value for the line.
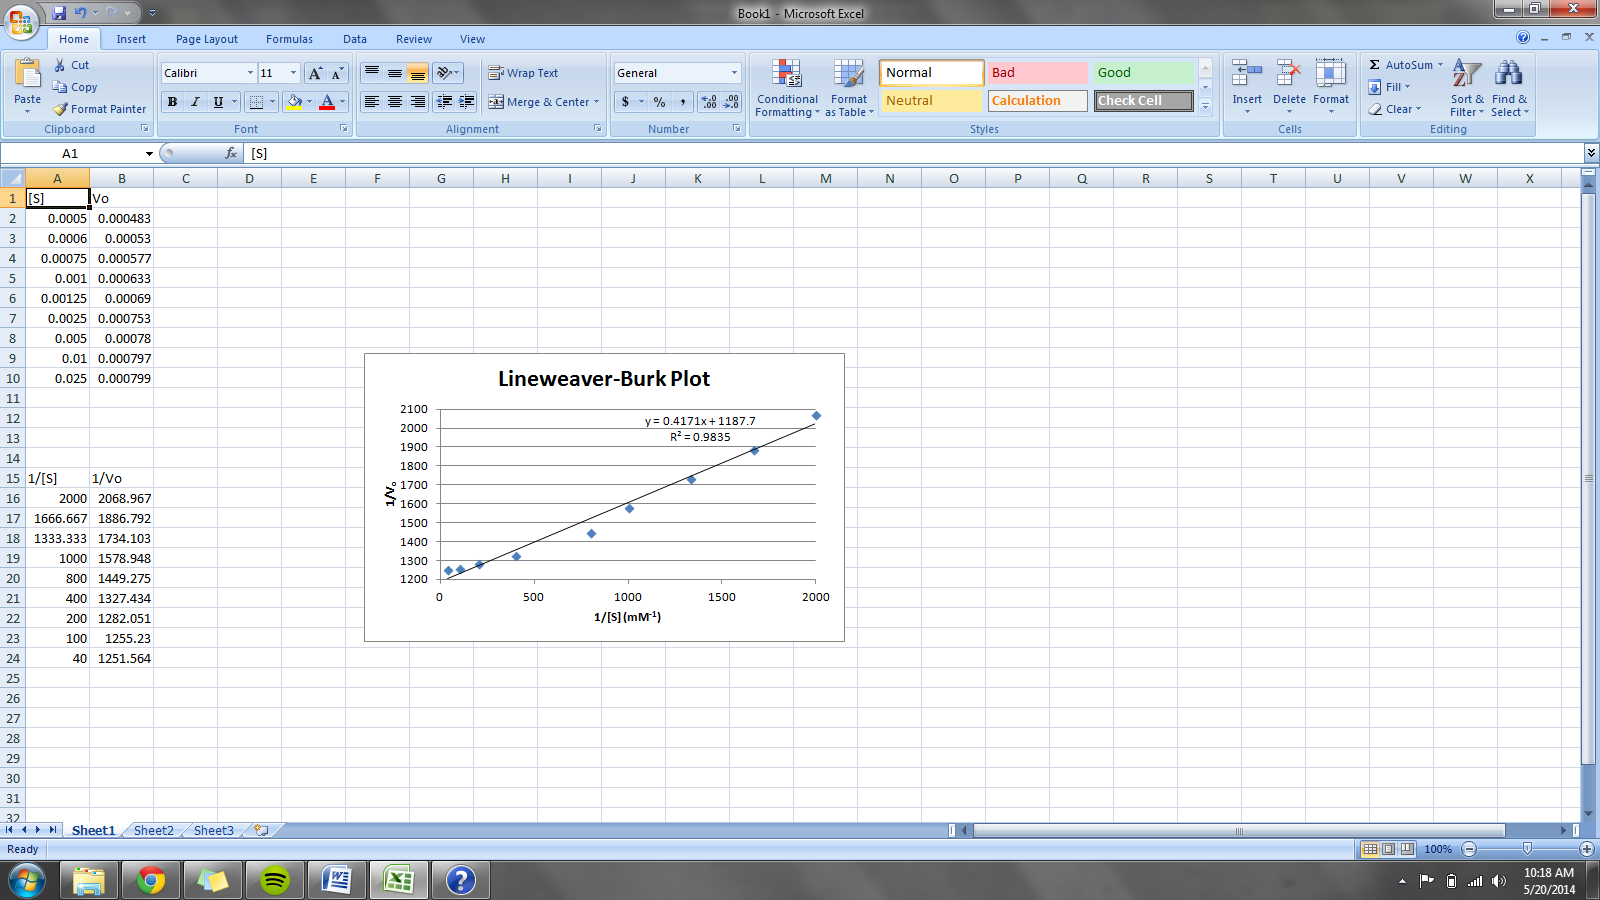
After closing this window, you’ve now successfully made a graph of your linear data with the equation that describes it. In this case, the final graph looks like so:
Tutorials for graphing data on Microsoft Excel 2013
First, enter your data into two columns with your x-variable on the left and your y-variable on the right.
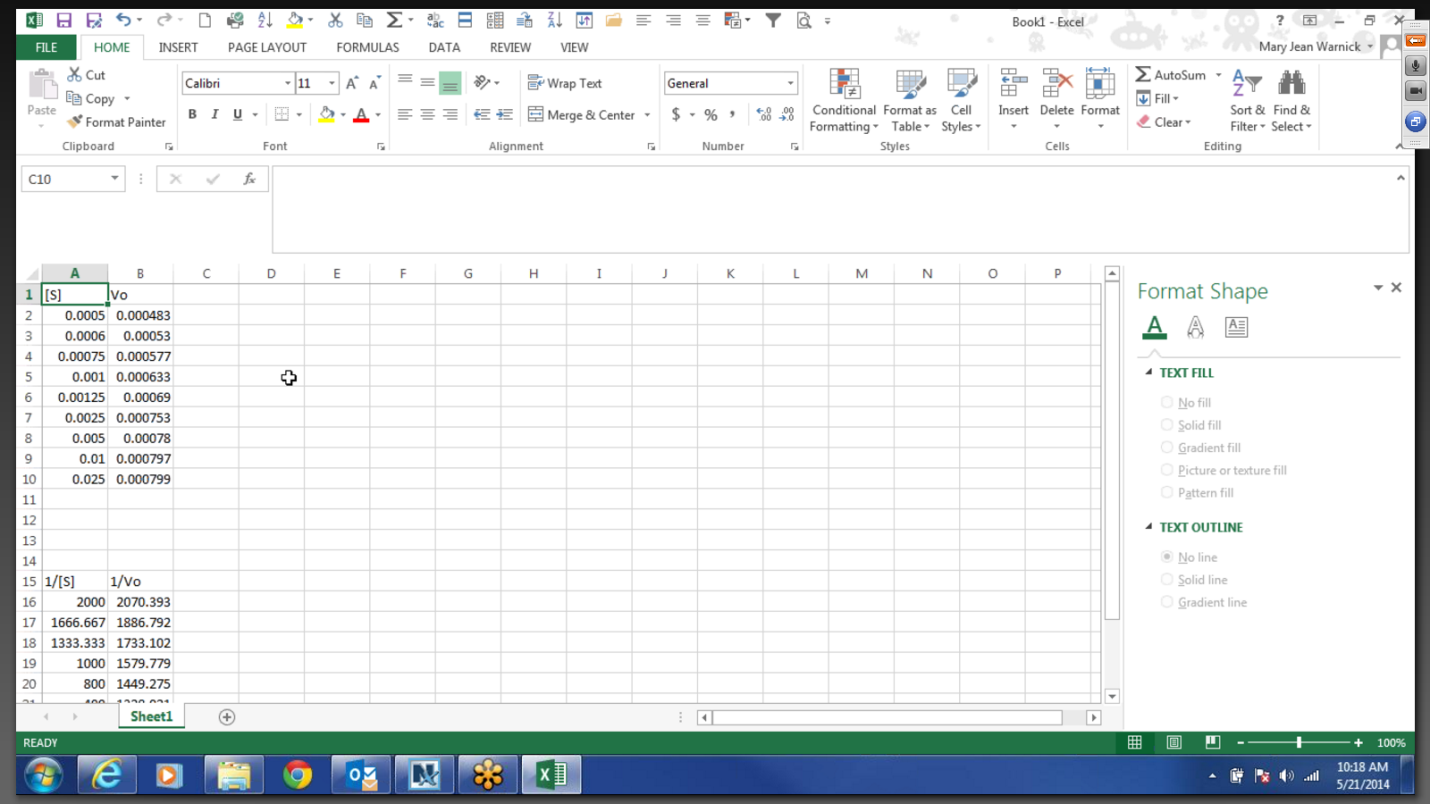
Next, highlight the columns you wish to graph. Go to the ‘Insert’ tab and click the ‘Scatter’ option, which will display a drop-down menu. Select the top left ‘Scatter’ option.
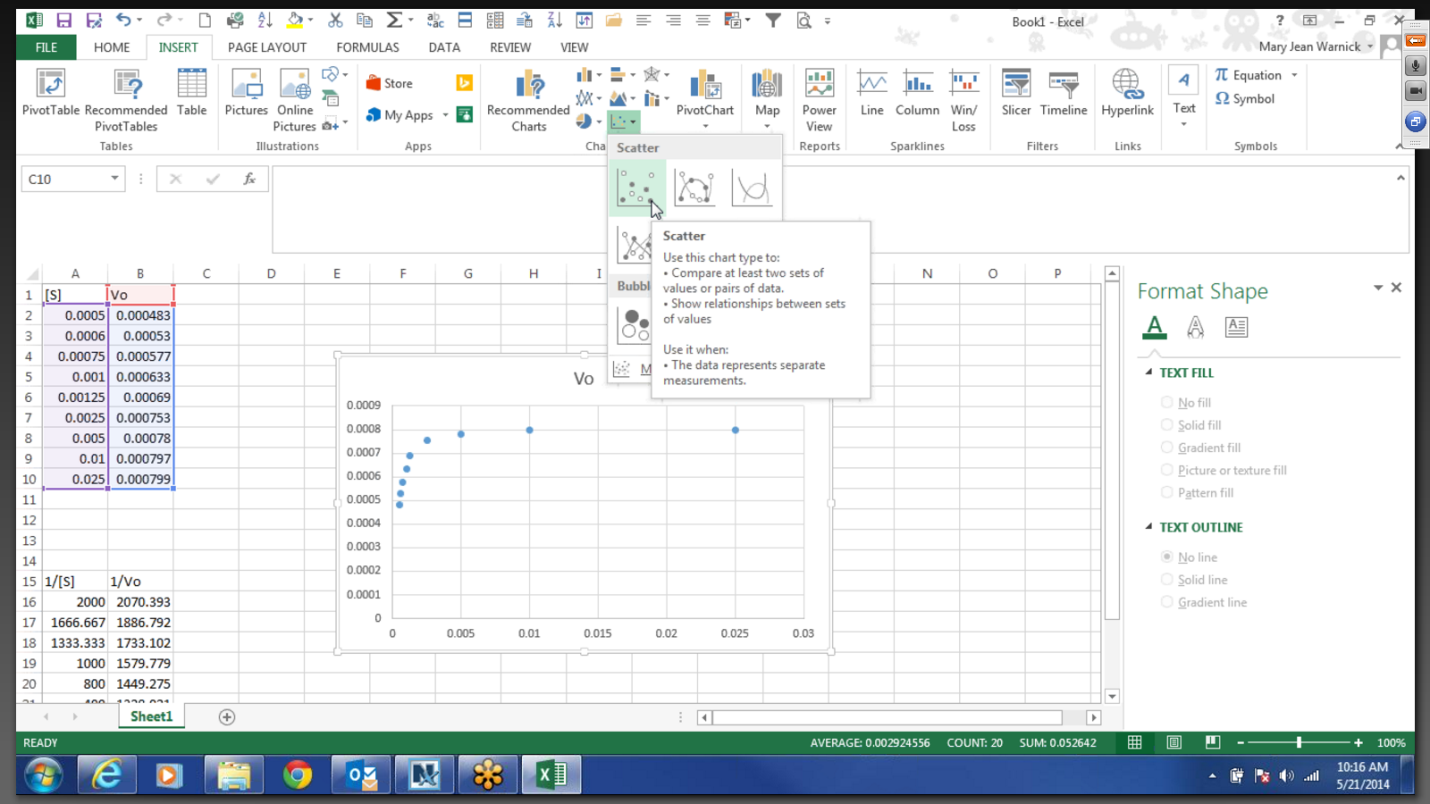
Now, the graph will appear and you can adjust it according to your data. Next, click the green plus sign next to the graph; a drop-down menu of ‘Chart Elements’ will appear. In order to add axis titles, simply select the box next to ‘Axis Titles’ and you can now type the titles into the text boxes.
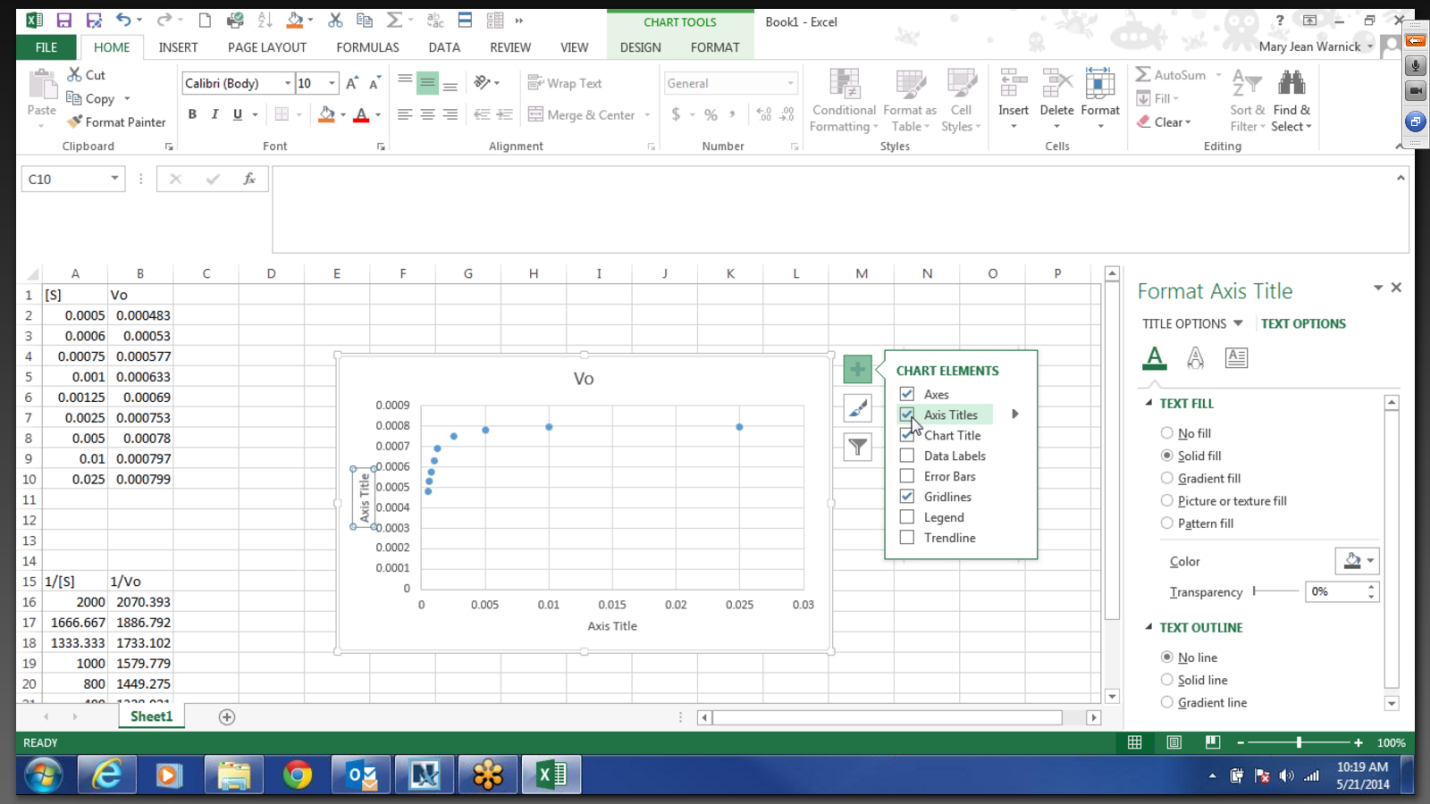
Furthermore, you can adjust the axes to suit your data. To do this, right click on the axis you wish to manipulate and select ‘Format Axis.’ ‘Axis Options’ will appear and you can set the bounds for each axis.
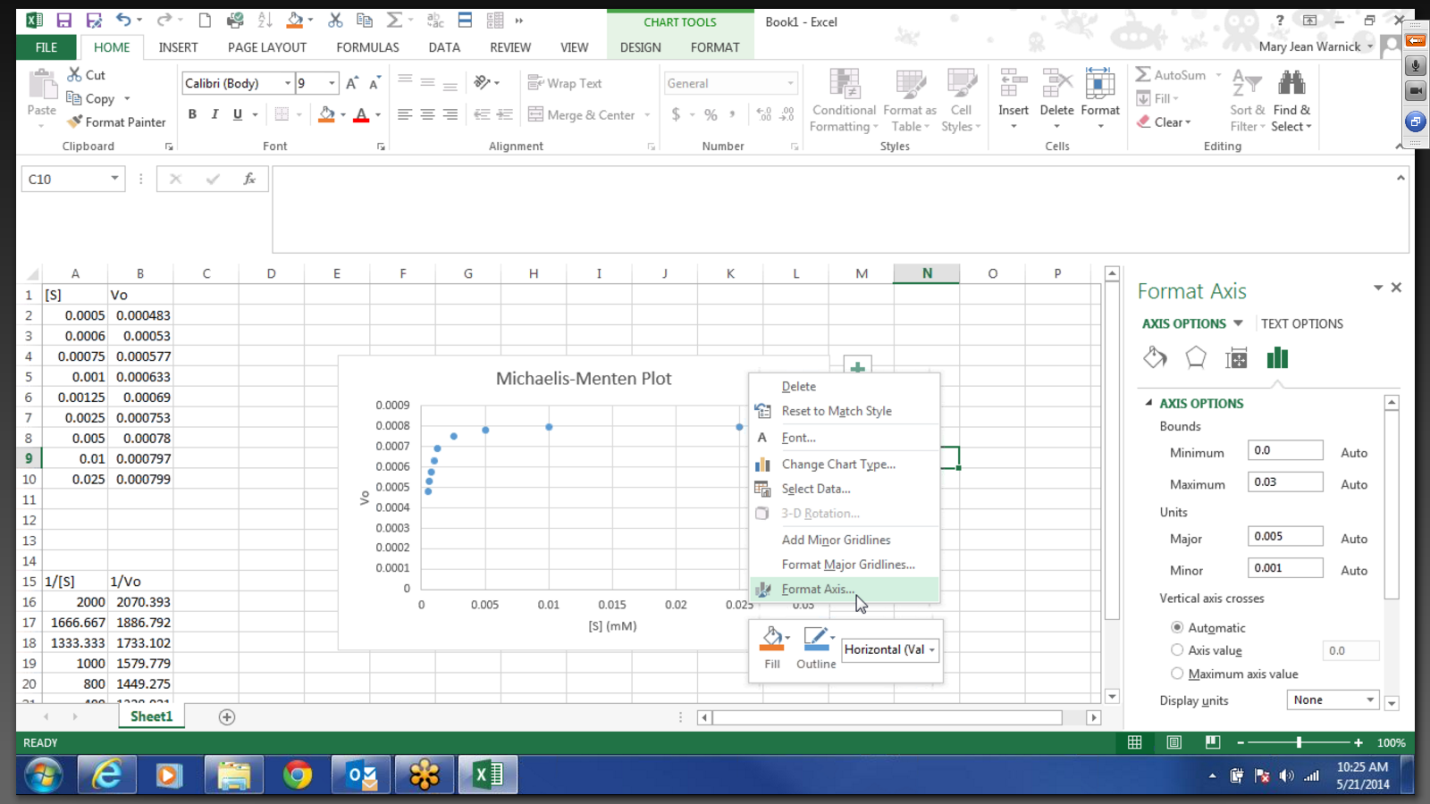
After adjusting your axes and closing that window, you’ve now successfully made a graph of your data in Excel. In this case, the final graph looks like so:
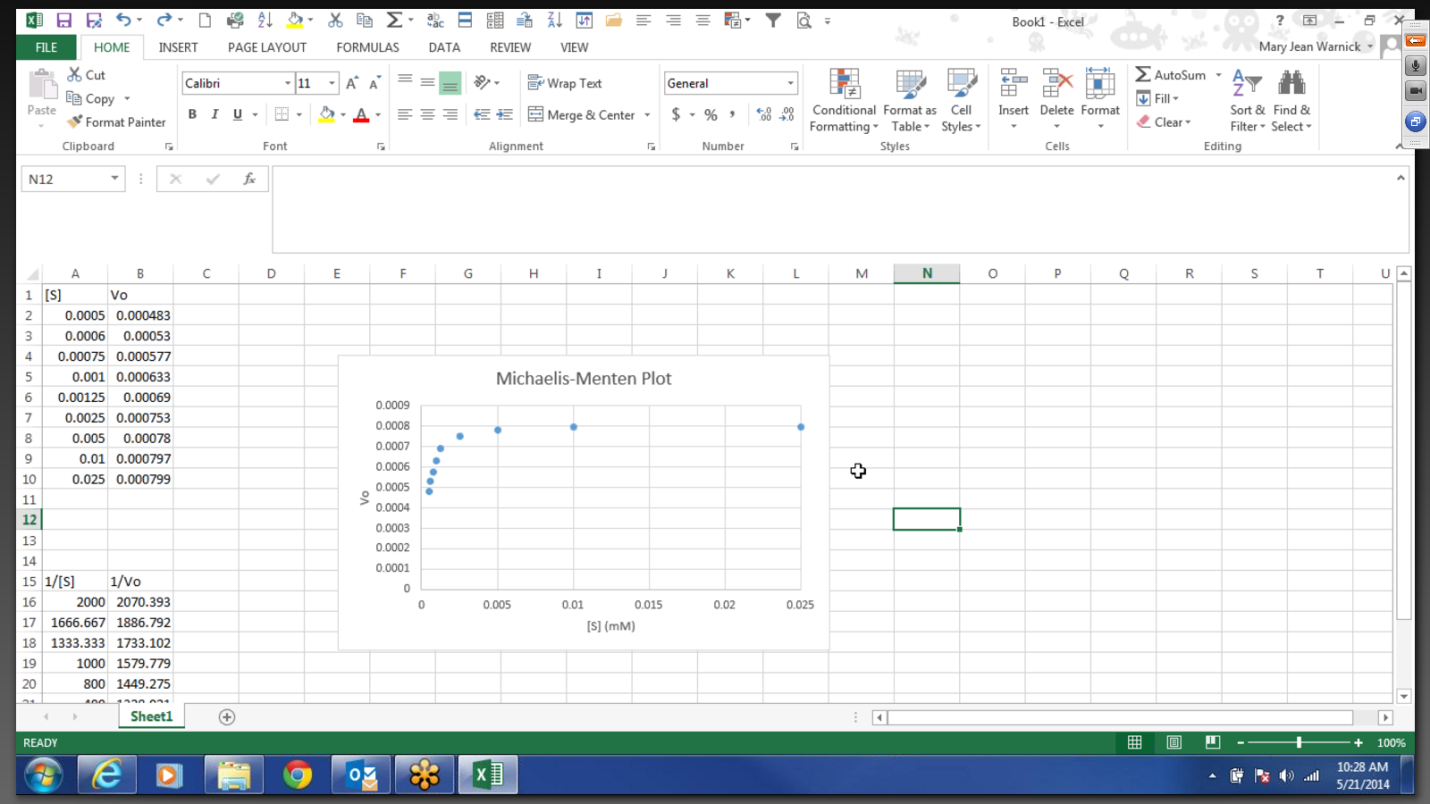
If your data is supposed to model a straight line, you may be interested in displaying the equation. If so, follow all the same steps as before to graph your data, then click on the green plus sign next to the graph to display the ‘Chart Elements.’ Select the box next to ‘Trendline.’ From here, click the arrow next to the ‘Trendline’ option, which will display a drop-down menu. Select ‘More Options.’
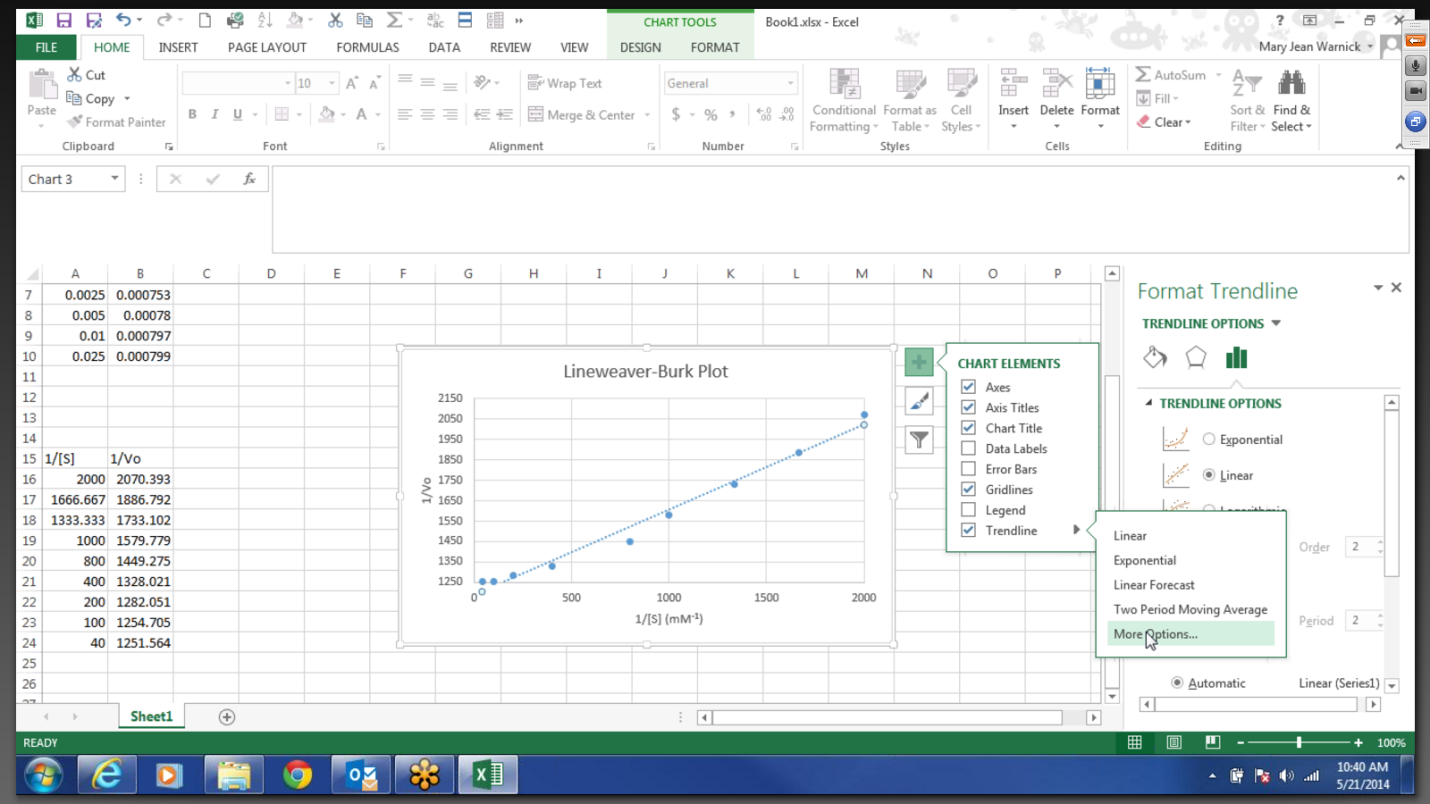
A new screen will appear with ‘Trendline Options.’ Now, you can select the type of fit you would like to do and you can choose to display the equation and R2 value for the line.
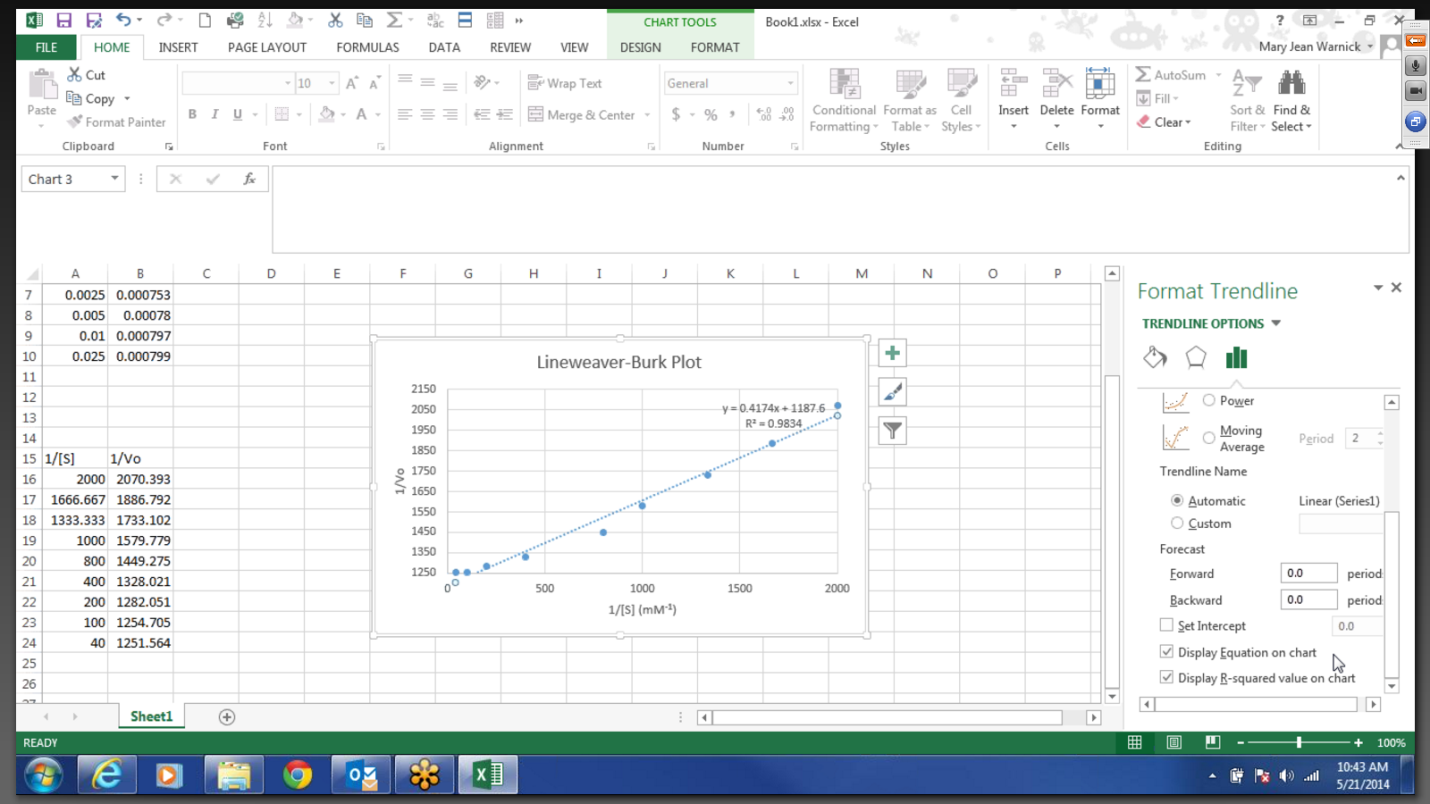
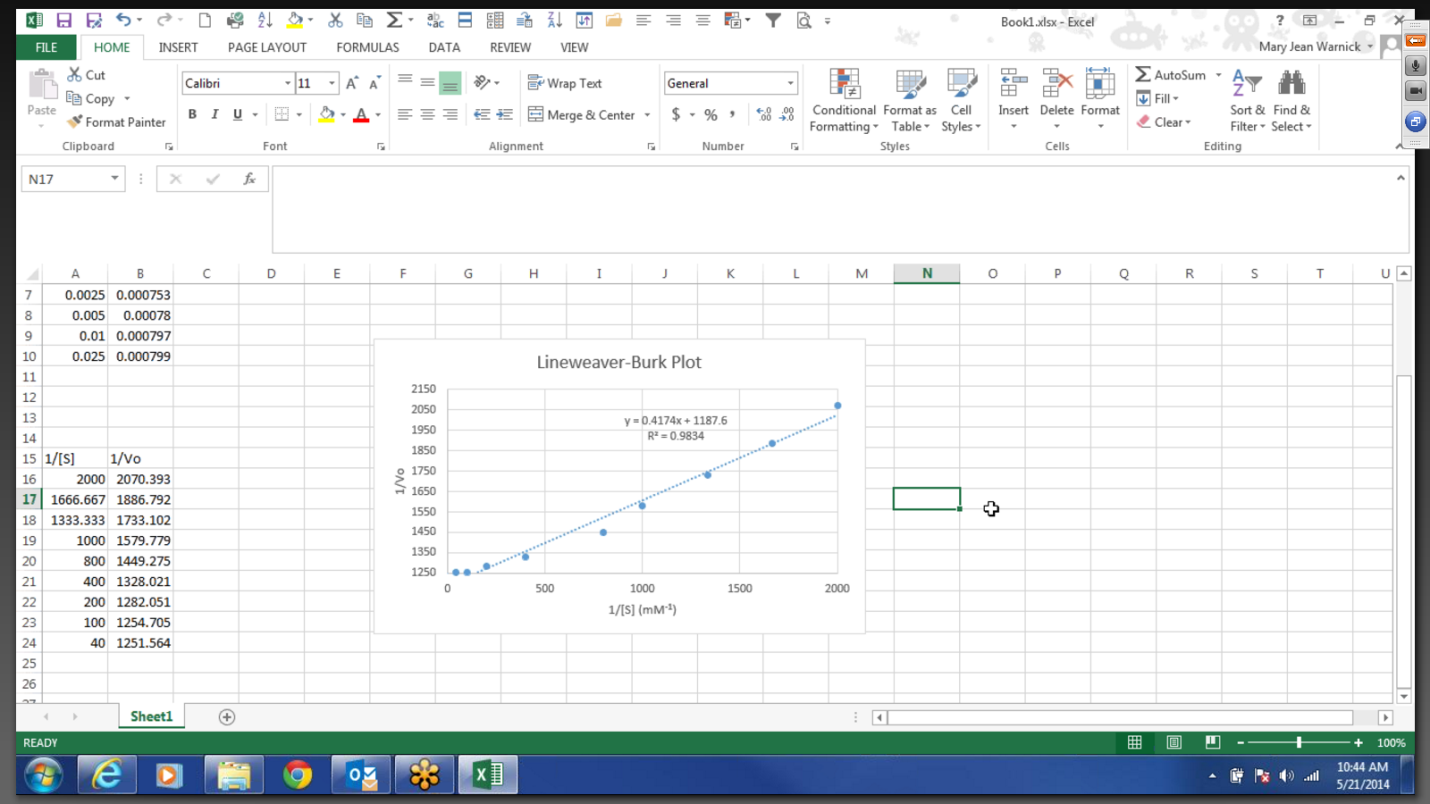
After closing this window, you’ve now successfully made a graph of your linear data and displayed the equation that describes it. In this case, the final graph looks like so:
1.4 Investigation
Run kinetics experiments on XYZase without inhibitors and with Compound X.
Results: The compound found in the coffee (Compound X) has yet to be identified, but using the small amount extracted, you have discovered that it is an inhibitor of XYZase. Given this revelation, it seems clear that this compound is the most likely murder weapon. Shown below is the data you have gathered. Note: [S] is given in nM; other values represent observed V0 values given in units of µmol product formed per minute.
| [S] (nM) | V0 (no inhibitor) | V0 (murder weapon: Cmpd X) |
|---|---|---|
| 50 | 0.14 | 0.040 |
| 75 | 0.19 | 0.050 |
| 150 | 0.32 | 0.080 |
| 400 | 0.47 | 0.14 |
1.
From the limited data you have gathered, does it appear that XYZase follows Michaelis-Menten kinetics?
| A. |
| B. |
2.
What is the Km of XYZase, in nM, within two significant figures?
1.5 Investigation (continued)
Given that Dr. Bleu appears to have been killed by an inhibitor to XYZase, you now have sufficient cause to search the labs of Drs. Greene, Gray, and Wight so that you can recover and test samples of the compounds they are each working on developing. This discovery has opened up a new investigation option! The new option is:
Search the labs and run kinetics experiments on suspicious samples
Results: By gathering samples from the labs of Drs. Wight, Greene, and Gray, you hope to discover which of these people may have had access to what is now clearly the murder weapon, compound X. Shown below is the data you have gathered. Note: [S] is given in nM; other values represent observed V0 values given in units of µmol product formed per minute.
| [S] (nM) | V0 (Sample 1) | V0 (Sample 2) | V0 (Sample 3) |
|---|---|---|---|
| 50 | 0.080 | 0.067 | 0.055 |
| 75 | 0.11 | 0.080 | 0.063 |
| 150 | 0.19 | 0.14 | 0.086 |
| 400 | 0.36 | 0.24 | 0.10 |
3.
Because you do not know with certainty the amounts of each inhibitor in solution (for example, the amount of the murder weapon you are adding the assay), you cannot directly compare the magnitude of inhibition shown by the murder weapon and by the gathered samples. How, then, can these samples be distinguished and compared using enzyme kinetics?
| A. |
| B. |
| C. |
| D. |
| E. |
| F. |
4.
Based on the information you have gathered, and your answers to previous questions, match the sample to the observed type of enzyme inhibition. Hint: You must graph the data and examine how each inhibitor affects the observed kinetic parameters. Please review pages 207-210 of Lehninger, 6th ed., before attempting this question.
| Sample 1 | |
| Sample 2 | |
| Sample 3 |
1.6 Investigation (continued)
You notice, however, that the samples you collected from the labs are now labeled 1, 2, and 3. You ask your lab assistants which samples correspond to which labs, but they mixed up the samples (somebody didn’t label the tubes when running the assays!). This is a disaster! Now, in addition to determining which sample (if any) matches the murder weapon, you are going to have to testify in court as a biochemist to convince a jury that the guilty sample (1, 2, or 3) belongs to the guilty person (Drs. Greene, Wight, or Gray) based on what you know about enzyme kinetics! Are you up to the challenge? Who killed Dr. Bleu?
The good news is that you may now go back to Hinesbiopharma and interview the three scientists about the molecular mechanism of the inhibitor each is working with. This has opened the following three new investigation options:
Interview Dr. Gray
Results: Dr. Gray is studying the effects of a transition-state analog. This molecule, which is a fluorinated lactone called F-lac by the company, mimics the geometry of the theoretical transition state in the XYZase reaction mechanism. Dr. Gray has solved crystal structures that have confirmed that F-lac binds noncovalently in the active site as expected.
5.
What type of inhibitor is being studied by Dr. Gray?
| A. |
| B. |
| C. |
| D. |
| E. |
Interview Dr. Greene
Results: Dr. Greene is studying a compound that binds noncovalently to an allosteric site on the protein approximately 20Å away from the active site. She has solved crystal structures, which have revealed that this allosteric site is blocked in the absence of substrate; a tryptophan residue blocks the ligand-binding pocket. When the enzyme binds the substrate, a shift in a helix connecting the active site and the allosteric site displaces the Trp sidechain, clearing the pocket and allowing the inhibitor to bind. When the inhibitor is bound, it prevents a nearby loop from moving to associate with the remainder of the active site. The association of this loop with the active site is necessary for catalysis to occur. Binding studies have confirmed predictions made by the crystal structures: in the absence of substrate, the inhibitor binds with a Kd of 10 mM, but in the presence of the substrate, the inhibitor Kd is decreased to 1 nM.
6.
What type of inhibitor is being studied by Dr. Greene?
| A. |
| B. |
| C. |
| D. |
| E. |
Interview Dr. Wight
Results: Dr. Wight works on an inhibitor of XYZase that acts by binding to a lysine residue in the enzyme active site, forming a Schiff base. This lysine is critical to function, normally acting as an acid in the enzyme mechanism. Stability studies have confirmed that under physiological conditions, the inhibitor−Schiff base linkage formed in the enzyme active site is extremely stable, with a half-life of more than 24 hours.
7.
What type of inhibitor is being studied by Dr. Wight?
| A. |
| B. |
| C. |
| D. |
| E. |
8.
If you were to analyze Dr. Wight’s inhibitor using enzyme kinetics, you would find that the numbers look very much like those that you would get if you had a certain type of reversible inhibitor. Irreversible inhibitors render the enzyme molecules they bind completely unable to perform catalysis. The effect is similar to decreasing the concentration of the enzyme in the enzyme assay. How does an irreversible inhibitor affect Km and Vmax? What type of reversible inhibitor does an irreversible inhibitor resemble in this manner?
| A. |
| B. |
| C. |
| D. |
1.7 Final Assessment Questions
9.
Based on the information you have gathered, and your answers to previous questions, match the samples to their respective scientists. Hint: review the information from interviews and answers to previously answered questions.
| Sample 1 | |
| Sample 2 | |
| Sample 3 |
10.
What type of inhibitor was compound X?
| A. |
| B. |
| C. |
| D. |
| E. |
11.
Based on their kinetic mechanisms of inhibition, which sample matches compound X?
| A. |
| B. |
| C. |
12.
Based on your answers to the previous questions, who is the murderer?
| A. |
| B. |
| C. |
Congratulations! You have finished this case study.
You have finished this case study.
Activity results are being submitted...