The number of neutrons differs among isotopes
In some elements, the number of neutrons in the atomic nucleus may vary. Different isotopes of the same element have the same number of protons but different numbers of neutrons, as you saw in the story opening this chapter. Many elements have several isotopes. Generally, isotopes are formed when atoms combine and/or release particles (decay). The isotopes of hydrogen shown here have special names, but for most elements their isotopes do not have special names.
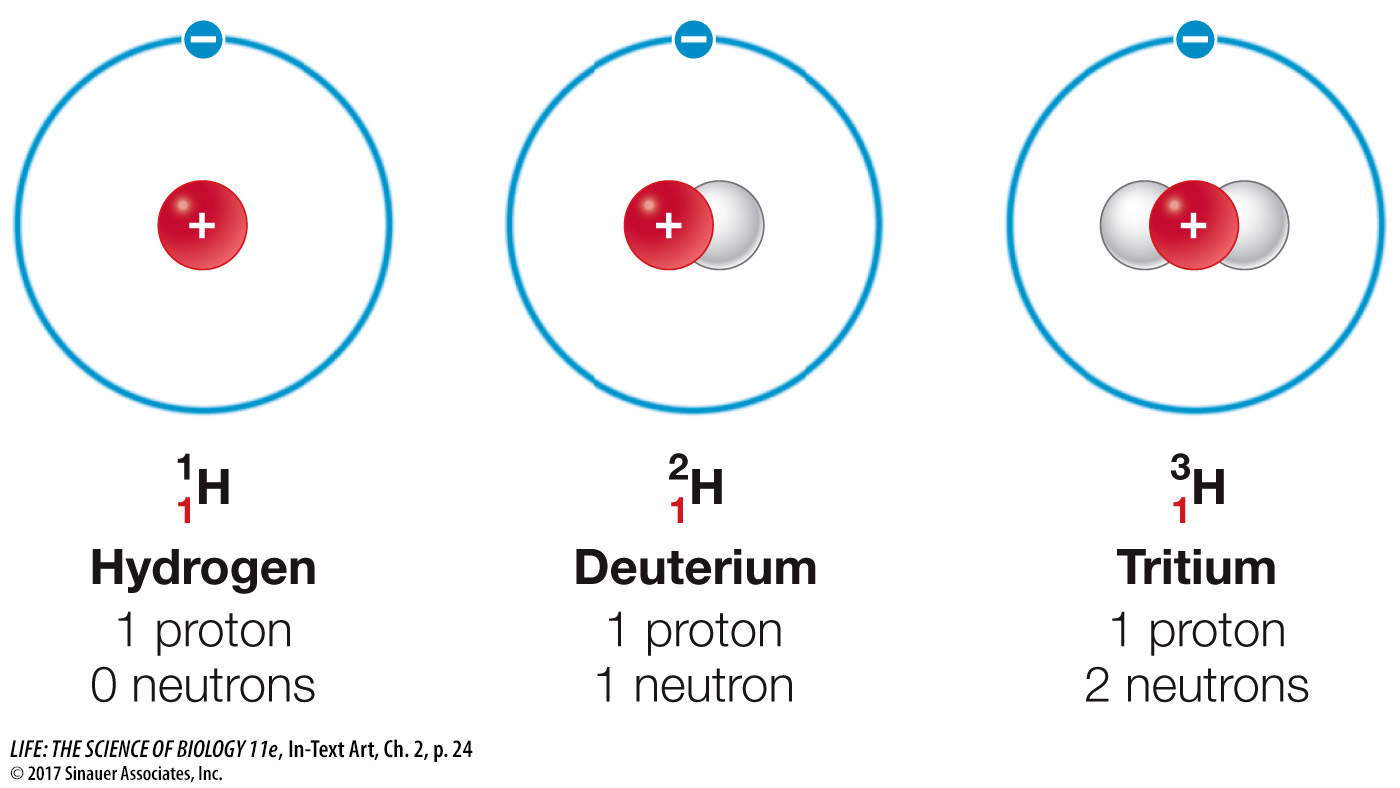
The natural isotopes of carbon, for example, are 12C (six neutrons in the nucleus), 13C (seven neutrons), and 14C (eight neutrons). Note that all three (called carbon-
An element’s atomic weight (or relative atomic mass) is equivalent to the average of the mass numbers of a representative sample of atoms of that element, with all the isotopes in their normally occurring proportions. More precisely, an element’s atomic weight is defined as the ratio of the average mass per atom of the element to 1/12 of the mass of an atom of 12C. Because it is a ratio, atomic weight is a dimensionless physical quantity—
investigating life
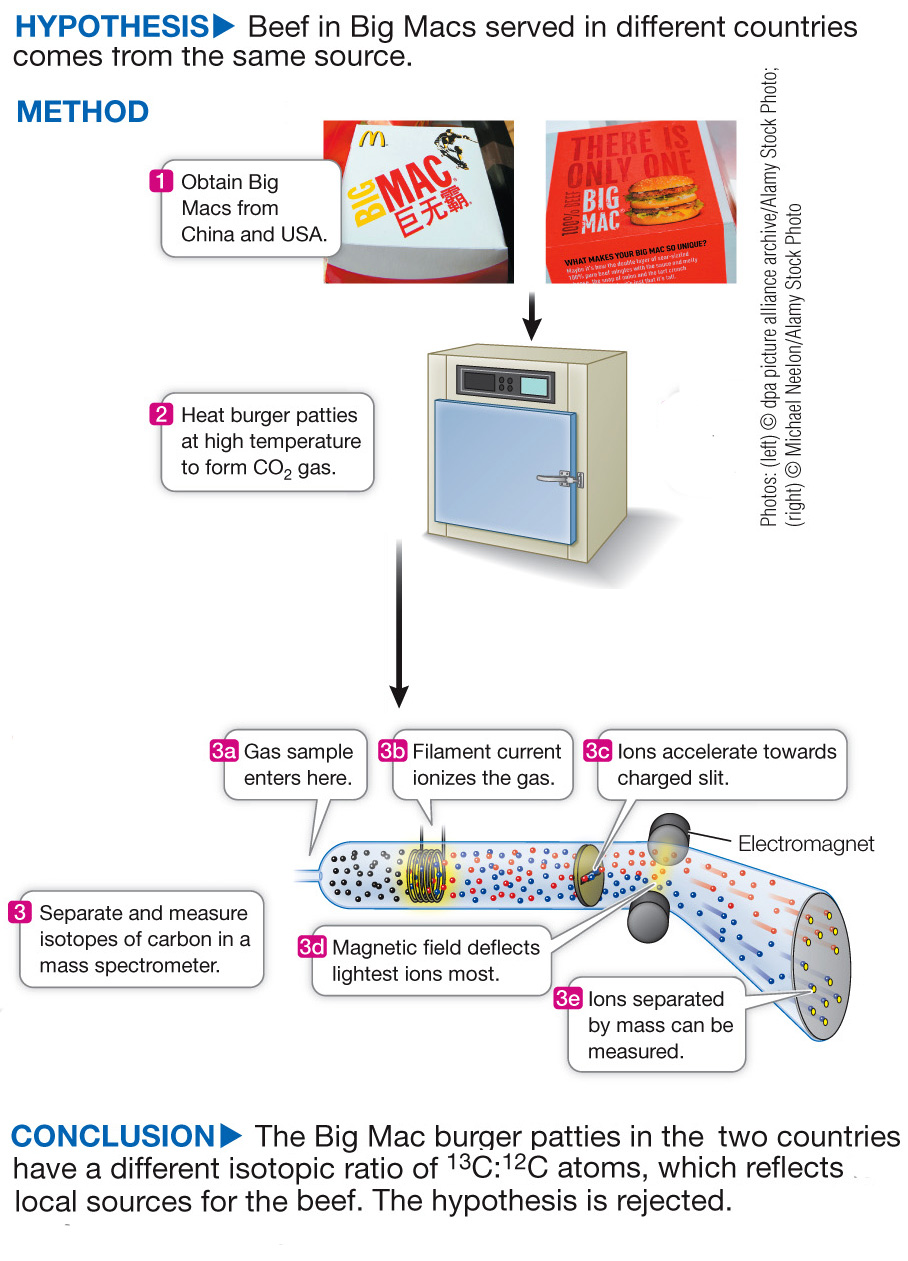
Determining Beef Source in Big Macs Using Isotope Analysis
experiment
Original Paper: Martinelli, L., G. Nardoto, L. Chesson, F. Rinaldi, J. P. H.B. Ometto, T. Cerling and J. Ehleringer. 2011. Worldwide stable carbon and nitrogen isotopes of Big Mac patties: An example of a truly “glocal” food. Food Chemistry 127: 1712–
The Big Mac hamburger can be purchased in 35,000 outlets in 120 countries. The recipe for the Big Mac is virtually the same everywhere; it is claimed that the burger has the same quality meat and nutritional quality everywhere it is served. To investigate this claim, Lesley Chesson and James Ehleringer at the University of Utah compared the ratio of 13C:12C in Big Mac patties around the world to determine whether the meat had a local or a common source. Beef cattle eat plant food, and carbon atoms from this food end up in meat. In some types of plants, the ratio of 13C:12C is higher than in others. Depending on which type of plants the cattle consume, the beef will also have a different 13C:12C ratio.
work with the data
The experiment compared the meat in Big Macs served in 25 different countries by measuring the ratio of stable carbon isotopes (13C:12C) in samples of ten beef patties from each country. The hypothesis was based on claims that the beef used in Big Macs comes from a single source, and that the 13C:12C ratio in patties found everywhere should thus be the same. Table A shows the average the 13C:12C ratio for each of the 25 countries. A higher number means more of the rare, stable isotope 13C than of the much more common 12C.
| Country | 13C:12C ratioa | Country | 13C:12C ratio | Country | 13C:12C ratio |
|---|---|---|---|---|---|
| All | 15.8 | Germany | 21.7 | Portugal | 20.7 |
| Argentina | 17.2 | Hungary | 22.0 | Scotland | 25.2 |
| Australia | 19.4 | Indonesia | 19.5 | Slovakia | 21.0 |
| Austria | 22.0 | Israel | 20.4 | South Africa | 13.0 |
| Brazil | 11.1 | Japan | 11.8 | Spain | 21.1 |
| Canada | 21.6 | Malaysia | 21.5 | Sweden | 23.2 |
| China | 13.9 | Mexico | 13.9 | Turkey | 20.5 |
| England | 25.4 | Netherlands | 20.7 | USA | 14.5 |
| France | 21.8 | Paraguay | 12.1 | Uruguay | 16.7 |
aMeasured in parts per million atoms (× 100).
QUESTIONS
1.
Do the average local ratios differ from the 25-
The average local ratios differ from the all-
2.
The countries from which the hamburgers were analyzed are in different locations on Earth. One way to compare locations is by geographic latitude. You may recall that in latitude, 0 degrees defines the equator and 90 degrees defines the poles. Table B shows average 13C:12C ratios of Big Mac beef patties from different latitudes. Plot the data on a graph of ratio versus latitude. What can you conclude from these data?
| Latitude | 13C:12C ratioa |
|---|---|
| 20°S– |
11.4 |
| 20°–40°b | 15.3 |
| 40°–60°b | 21.8 |
aAverage value measured in parts per million atoms (× 100).
b20°S–
A graph of the data shows an increasing 13C:12C ratio as latitude away from the equator increases. This implies that different plants occur in different regions. Animal feeds used locally tend to be composed of plants grown locally.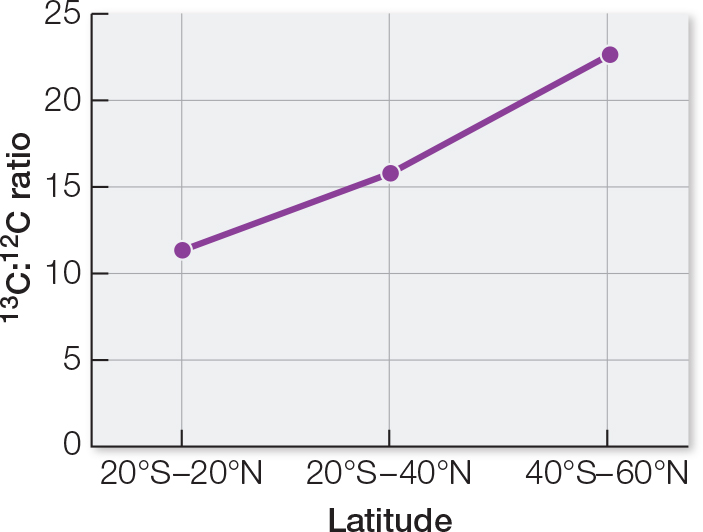
A work with the data exercise that accompanies this figure may be assigned in LaunchPad.
Most isotopes are stable. However, some, called radioisotopes, are unstable and spontaneously give off energy in the form of α (alpha), β (beta), or γ (gamma) radiation from the atomic nucleus. Known as radioactive decay, this release of energy transforms the original atom. The type of transformation varies depending on the radioisotope, but some transformations result in a different number of protons, so that the original atom becomes a different element.
Scientists can detect released radiation from *radioisotopes. For instance, if you feed an earthworm food containing a radioisotope, you can follow the worm’s path through the soil by using a detector called a Geiger counter. Most atoms in living organisms are organized into stable associations called molecules. If a radioisotope is incorporated into a molecule, it acts as a tag or label, allowing a researcher or physician to track the molecule in an experiment or in the body (Figure 2.3).
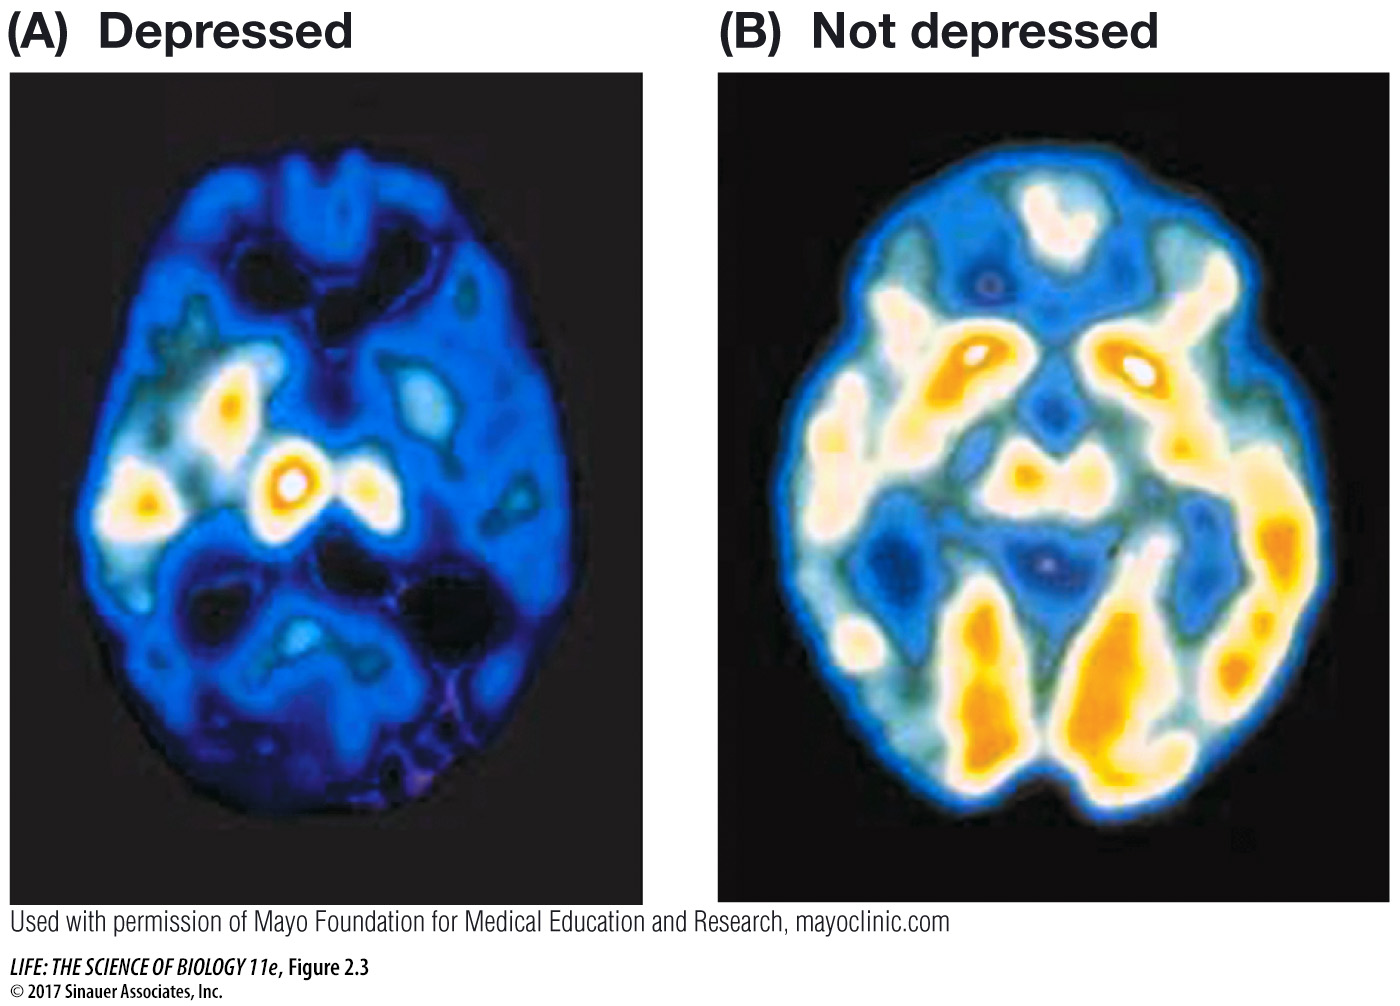
Q: How could this technique be used in the clinic?
The technique could be used to monitor therapy. As therapy progresses and the patient improves, one would expect that the brain region involved would show more activity.
*connect the concepts Radioisotopes are also used to analyze biochemical pathways (see Key Concept 10.3) and to date fossils (see Key Concept 24.1).
Although radioisotopes are useful in research and in medicine, even a low dose of the radiation they emit has the potential to damage molecules and cells. However, these damaging effects are sometimes used to our advantage; for example, the radiation from 60Co (cobalt-