How were the steps in carbohydrate synthesis elucidated?
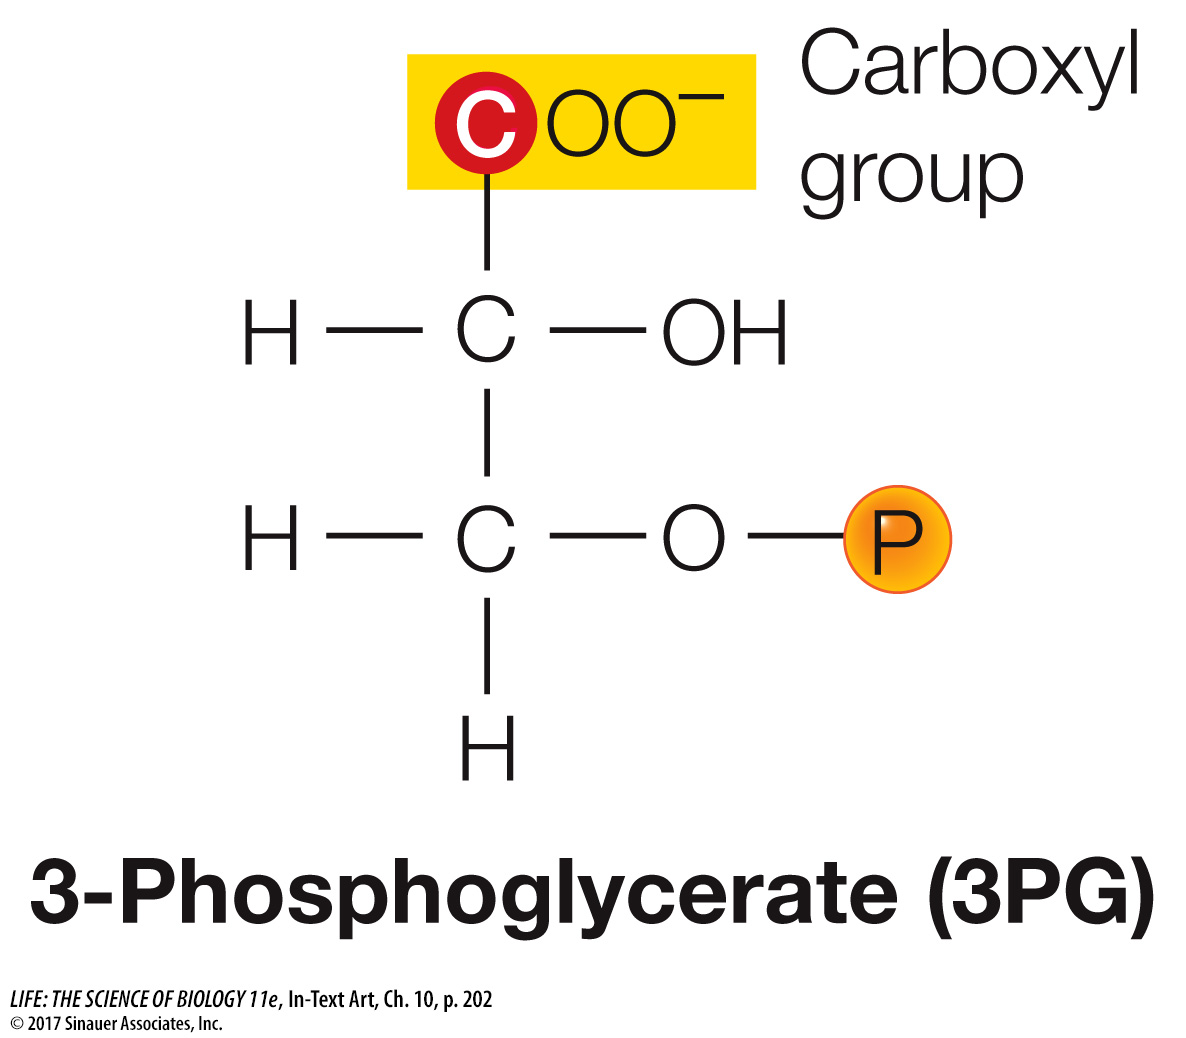
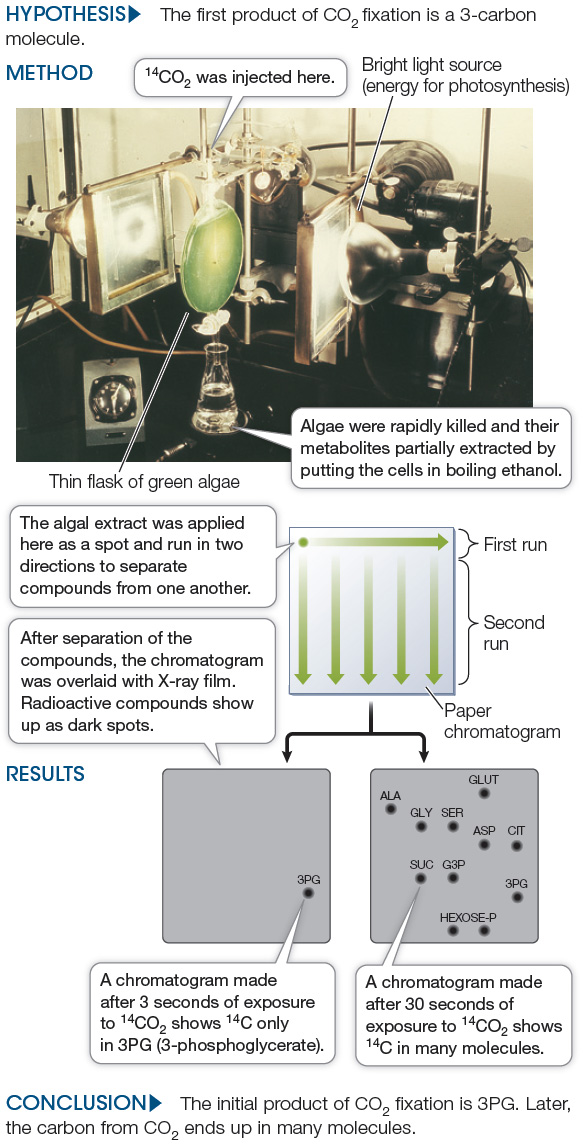
To identify the reactions by which the carbon from CO2 ends up in carbohydrates, scientists found a way to label CO2 so they could isolate and identify the compounds formed from it during photosynthesis. In the 1950s, Melvin Calvin, Andrew Benson, and their colleagues used radioactively labeled CO2 in which some of the carbon atoms were the radioisotope 14C rather than the normal 12C. They were able to trace the chemical pathway of CO2 fixation (Figure 10.10). The first molecule that appeared in the pathway was a three-

experiment
Figure 10.10A Tracing the Pathway of CO2
Original Papers: Calvin and his colleagues described their experiments in a series of 26 papers titled “The Path of Carbon in Photosynthesis.” Perhaps the most important was one that showed how labeled CO2 could be used a tracer:
Benson, A. A., J. A. Bassham, M. Calvin, T. C. Goodale, V. A. Haas and W. Stepka. 1950. The path of carbon in photosynthesis. V. Paper chromatography and radioautography of the products. Journal of the American Chemical Society 72: 1710–
How is CO2 incorporated into carbohydrate during photosynthesis? What is the first stable covalent linkage that forms with the carbon of CO2? Melvin Calvin and his colleagues used short exposures to 14CO2 to identify the first compound formed from CO2.

Figure 10.10B work with the data follows on the next page.
work with the data
Figure 10.10B Tracing the Pathway of CO2
Original Paper: Benson, A. A. et al. 1950.
To elucidate the sequence of reactions that allow carbon fixation, Melvin Calvin and colleagues exposed suspensions of the green alga Chlorella to 14CO2 (see Figure 10.10A). After 3 sec of photosynthesis, the 14C from 14CO2 was found only in 3-
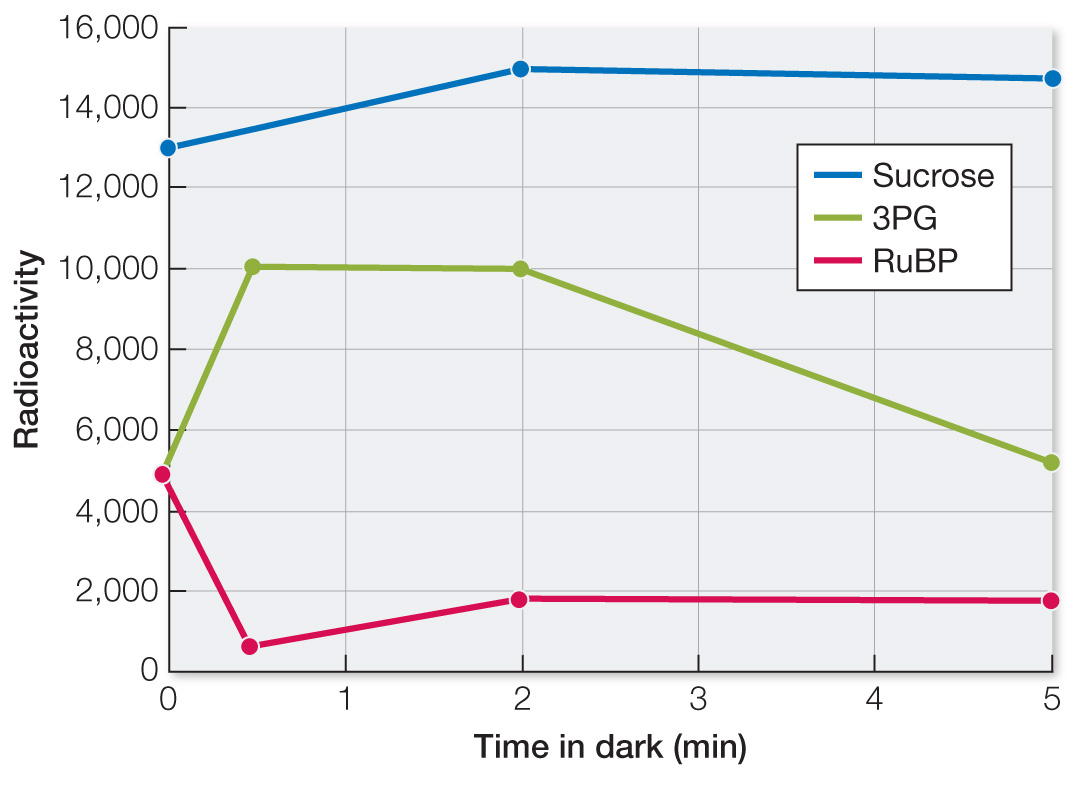
The first reaction in CO2 fixation can occur in the dark. To show this, Calvin and his colleagues exposed Chlorella cells to 14CO2 under bright lights for 20 min and harvested the cells. Then they repeated the experiment, but following the 20 min of light with varying periods of darkness (30 sec, 2 min, and 5 min). They harvested cells and made chromatograms to identify the labeled compounds, and used a radioactivity detector to quantify the amount of 14C in each compound. The data are shown in the table.
| Relative amount of radioactivity after: | ||||
|---|---|---|---|---|
| Compound | 20 min light | 20 min light + 30 sec dark |
20 min light + 2 min dark |
20 min light + 5 min dark |
| 3PG | 5,500 | 10,100 | 10,000 | 5,200 |
| RuBP | 4,900 | 680 | 1,850 | 1,800 |
| Sucrose | 13,000 | 13,500 | 15,000 | 14,750 |
QUESTIONS
1.
Plot radioactivity in 3PG versus time. What do the data show?
The data show an initial rise of 3PG (in first 30 sec) because rubisco is initially still active and can catalyze the reaction of CO2 with RuBP to produce 3PG. Between 30 sec and 2 min, the amount of 3PG levels off as rubisco becomes inactive in the dark. After 2 min, the amount of 3PG falls as it enters other pathways (see Figure 10.18). 
2.
Why did the amount of radioactively labeled RuBP decline after 30 seconds in the dark?
The level of RuBP went down in the dark initially because it was consumed in the reaction catalyzed by rubisco.
Animation 10.3 Tracing the Pathway of CO2
A similar work with the data exercise may be assigned in LaunchPad.
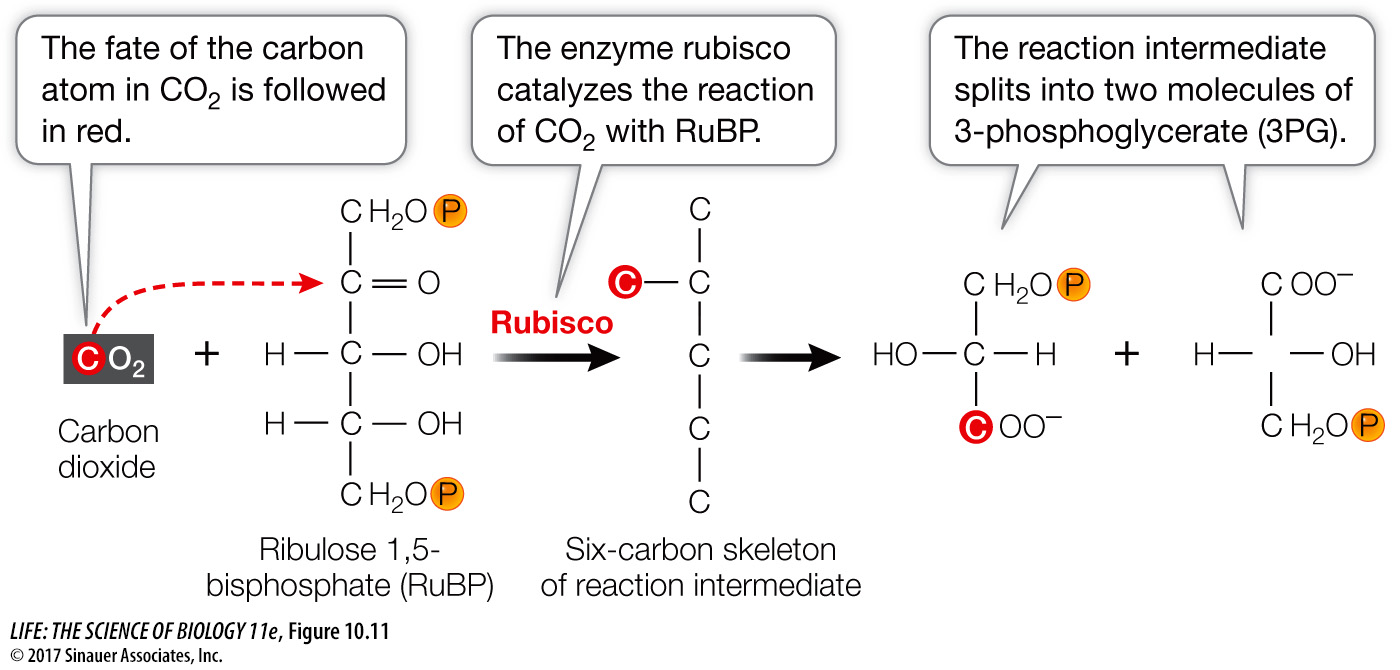
Using successively longer exposures to 14CO2, Calvin and his colleagues were able to trace the route of 14C as it moved through a series of compounds, including monosaccharides and amino acids. It turned out the 14C moved through a cyclical pathway. In this cycle, the CO2 initially bonds covalently to a five-
The initial reaction in the Calvin cycle adds the one-
