Original Paper: Loach, K. 1967. Shade tolerance in tree seedlings: I. Leaf photosynthesis and respiration in plants raised under artificial shade. New Phytologist 66: 607–621.
Some plants are shade-tolerant, and others thrive in sunlight. This phenomenon raises questions, because all plants use the same basic photosynthetic process. What makes shade-tolerant plants different from shade-intolerant plants, allowing them to grow well in low light? Can plants adapt to cope with unfavorable lighting conditions?
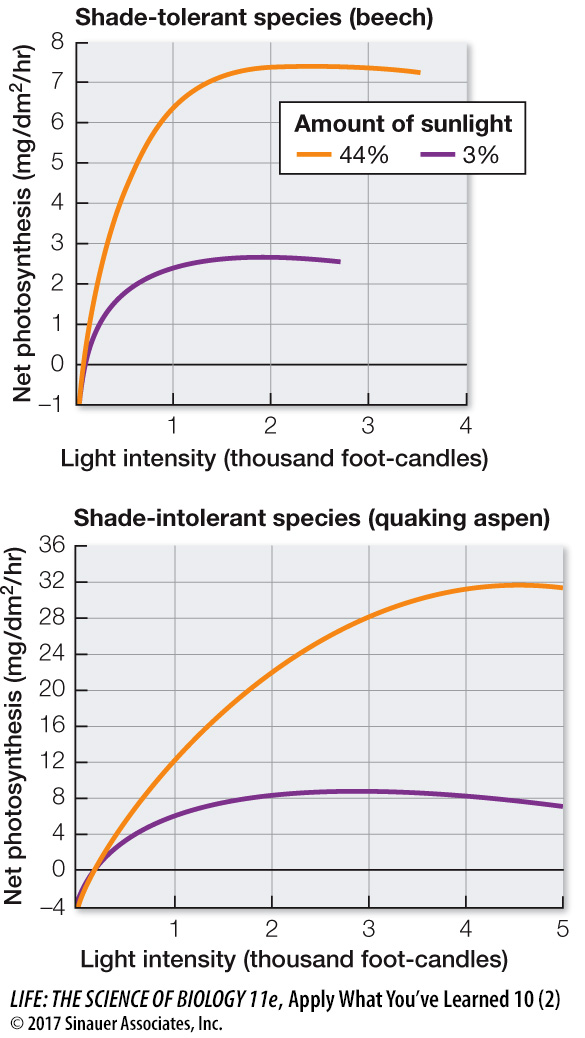
Researchers explored these questions by studying seedlings of two tree species—one shade-tolerant (beech) and one shade-intolerant (quaking aspen). The researchers planted newly germinated seedlings of both species under frames and covered the frames with shade cloth, limiting the amount of sunlight getting through to either 3% or 44% of normal daylight.
After 5 weeks the researchers moved one leaf, still attached to each plant, out of the frame so it could be studied briefly. They exposed each leaf to varying light intensities for several minutes, while measuring the rate of photosynthesis in its cells. Then leaves were removed and analyzed for chlorophyll content by mass, density of chlorophyll in the leaf, and leaf surface area. The last measurement was expressed as surface area per gram of leaf tissue so that the two species, which have different leaf sizes, could be compared. The results are shown in the graphs at right and in the table below. Note on the x-axis that normal daylight is about 4.5 thousand foot-candles.
Total cholorophyll
Species
Shade tolerance
Cultivation light intensity (% sunlight)
(mg/g dry weight leaf)
(mg/dm2 leaf)
Specific leaf surface area (dm2/g)
Beech
Very tolerant
44
3.26
1.53
2.13
3
7.02
2.82
2.49
Quaking aspen
Very intolerant
44
6.34
3.62
1.57
3
8.23
4.38
1.88
Questions
1.
In the graphs showing photosynthesis rates as a function of light intensity, every curve has the same basic shape. Why does the photosynthesis rate represented by each curve increase as the leaf is exposed to higher light intensities?
Light stimulates the light reactions to occur, which then stimulates the Calvin cycle. Also, light-induced changes activate Calvin cycle enzymes.
2.
Look at the y-axis values on the two graphs, and compare the maximum photosynthesis rates for the two tree species. What does this suggest about a difference between shade-tolerant plants and shade-intolerant plants?
Shade-tolerant plants have much lower maximum rates of photosynthesis even when raised in the same light conditions as shade-intolerant plants and exposed to the same light intensities. This suggests that either there are fewer light-harvesting centers and fewer Calvin cycle enzymes in shade-tolerant plants, and/or that the Calvin cycle enzymes of shade-tolerant plants are adapted to function at lower rates than those of shade-intolerant plants.
3.
Analyze the chlorophyll data in the table. In general, how and why do plants adjust their levels of chlorophyll when raised in different light conditions?
Both shade-tolerant and shade-intolerant plants develop more chlorophyll when raised under greater degrees of shade. This helps compensate for the low light levels to allow the plants to collect greater amounts of light.
4.
Analyze the leaf surface area data in the table. How do shade-tolerant plants compare with shade-intolerant plants in specific leaf surface area, and why does this support adaptation to shade?
Specific leaf surface areas are larger in shade-tolerant plants. This allows the light-harvesting centers to be spread out as much as possible so that they can capture maximum light under shade conditions. This helps compensate for the low light levels to allow the plants to collect enough light to carry out photosynthesis.
5.
Predict which type of plant (shade-tolerant or shade-intolerant) will have the greatest fluctuation in photosynthesis rates over time in response to changes that occur in a single day as the skies go from overcast to clear and back to overcast.
The shade-intolerant plants will have a much greater fluctuation in photosynthesis rate than the shade-tolerant plants. This prediction is made based on the much larger range of photosynthesis rate data in the graph of the shade-intolerant species compared with that of the shade-tolerant species.