recap
22.4 recap
Reproductive isolation may result from prezygotic or postzygotic isolating mechanisms. Lower fitness of hybrids can lead to the reinforcement of prezygotic isolating mechanisms.
learning outcomes
You should be able to:
Create graphical representations of hybridization frequencies and analyze data to develop hypotheses about postzygotic isolation.
Design an experiment to investigate a given isolating mechanism.
Relate the width and/or persistence of a hybrid zone to the fitness of hybrid offspring.
1.
As shown in Figure 22.11, the leopard frogs Rana berlandieri and R. sphenocephala usually have non-
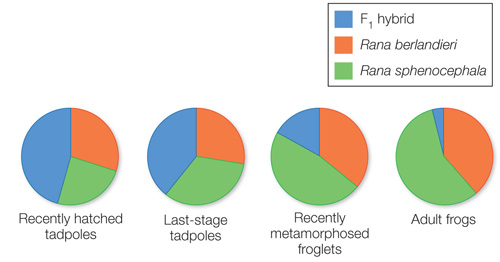
Imagine you have collected and tabulated data on hybridization between these two frog species. You have sampled various life stages of frogs and their tadpoles for 2 years after an initial spring breeding season at a newly established pond. Use the data below to answer the following questions.
| Life stage | R. berlandieri | R. spheno- |
F1 hybrids |
|---|---|---|---|
| Recently hatched tad- (spring, year 1) |
155 | 125 | 238 |
| Late- (summer, year 1) |
45 | 55 | 64 |
| Newly metamorphosed froglets (fall, year 1) |
32 | 42 | 15 |
| Adult frogs (year 2) | 10 | 15 | 1 |
Create four pie charts (one for each life stage) showing the percentage of each species and the percentage of hybrids at each stage.
What are possible reasons for the differences in the percentages of hybrids found at each life stage? Suggest some postzygotic isolating mechanisms that are consistent with your data.
Over time, what changes might you expect in the breeding seasons of the two species at this particular pond, and why? How would future pie charts differ from those you created above, if your predictions about breeding seasons are correct?

- Hybrids represent a smaller proportion of the samples at each successive life stage, indicating lower hybrid survivorship compared to either parental type. Postzygotic isolating mechanisms that are consistent with this pattern include low hybrid zygote viability and (for the adult frogs) low hybrid adult viability.
- Selection against hybridization would favor non-
overlapping breeding seasons between the two species. Over time, more individuals that result from offset breeding seasons would be expected to survive (since no hybrids are produced in these cases). Assuming there is a genetic component that influences when a frog will breed, the populations would be expected to shift to produce non- overlapping breeding seasons (as seen in allopatric versus sympatric populations of these two species; see Figure 17.9). As overlap between breeding seasons is reduced, we would expect to see fewer hybrids at every life stage.
2.
In each of the columbine (Aquilegia) species shown in Figure 22.13, the orientation of the flowers and the length of flower spurs are associated with a particular type of pollinator (hummingbirds or hawkmoths). Columbine flowers vary in other ways as well—
There are many possible designs of experiments that might prove informative. Here is an example of one that would examine the effect of flower position on pollinator attraction: Take one species of flower and divide the flowers into two groups. Position each flower to be either upright or pendant, then record the number and type of pollinators that are attracted to flowers in each group. Test to see if the differences between the two groups are statistically significant.
3.
Why don’t most narrow hybrid zones, such as the one between Bombina bombina and B. variegata shown in Figure 22.14, get wider over time?
There is gene flow into the hybrid zone, but the hybrid zone acts as a “genetic sink.” The hybrids are less fit compared to either parental type, so there is little gene flow out of the hybrid zone. An expanding hybrid zone would require hybrids to move out of the hybrid zone and compete successfully against individuals of each of the two parental species.
Some groups of organisms have many species, others only a few. Hundreds of species of Drosophila evolved in the small area of the Hawaiian Islands over about 20 million years. In contrast, there are only a few species of horseshoe crabs in the world, and only one species of ginkgo tree, even though these latter groups have persisted for hundreds of millions of years. Why do different groups of organisms have such different rates of speciation?