Apply What You’ve Learned
Review
23.1
Simple counts of nucleotide substitutions or amino acid replacements between sequences often underestimate the underlying changes.
23.2
The rate of fixation of neutral nucleotide changes within populations is independent of population size.
23.3
Comparing rates of synonymous and nonsynonymous substitutions can be used to identify positive and purifying selection in protein genes.
By studying molecular evolution patterns of genes, biologists are able to make inferences about various types of natural selection operating on them. These inferences are important to our understanding of how genes function and how they evolve through time in response to selection for new functions or new conditions.
A hypothetical gene encodes a transcription factor in various Drosophila species. The phylogeny of these species is shown below, with divergence times shown in millions of years.
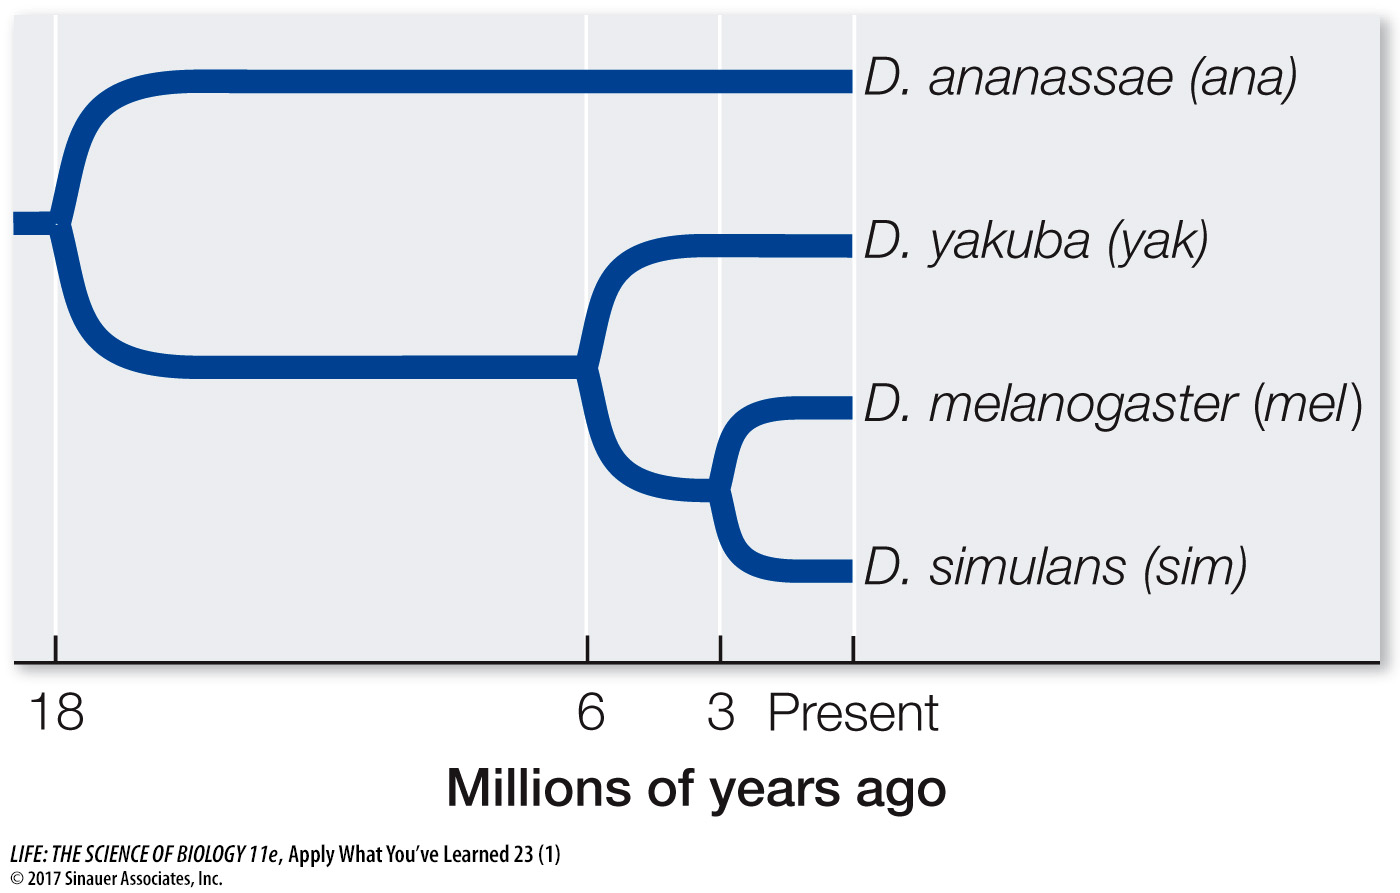
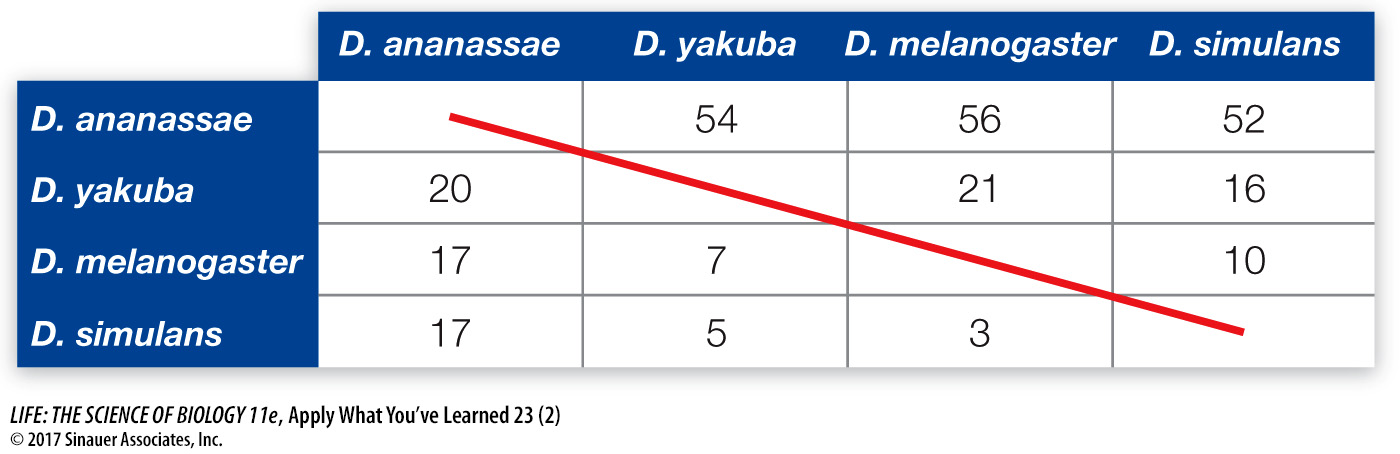
One exon of this gene has been sequenced in the four species. Below is a matrix representing the number of synonymous (above the diagonal) and nonsynonymous (below the diagonal) substitutions between pairs of species. For instance, there are 21 synonymous substitutions between D. melanogaster and D. yakuba. There are 2000 nonsynonymous and 600 synonymous sites in this exon, and there are five generations per year.
Answers to the questions below will provide information about the types of selection operating on this transcription factor and, potentially, its function.
Questions
1.
Graph the relationship between the number of synonymous substitutions and the years of divergence between each pair of species. Label both axes. Use this graph to estimate the rates of synonymous substitutions per million years and per generation for the whole exon and on a per-
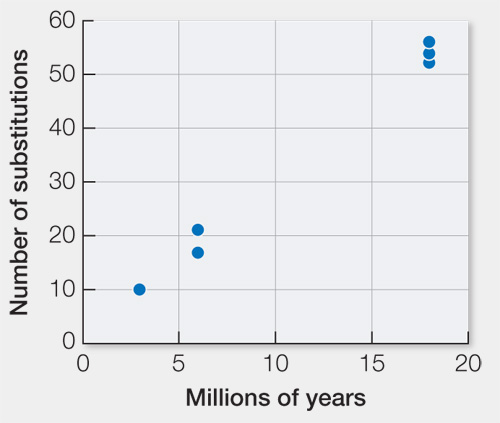
There are, on average, 54 synonymous substitutions between lineages that diverged 18 million years ago (36 million years of evolution altogether). Thus, there have been about 1.5 synonymous substitutions per million years for the entire exon. Given 5 generations per year and 600 synonymous sites, the rate is 3 × 10⁻⁷ synonymous substitutions per generation for the entire exon and 5 × 10⁻¹⁰ synonymous substitutions per site.
2.
Assume that synonymous substitutions are neutral. What is the expected per-
The per-
3.
Houseflies (Musca domestica) diverged from D. melanogaster about 90 million years ago. Suppose there are 174 synonymous substitutions between these two taxa. Assume that the number of generations remains constant at five per year across these species. Calculate the expected number of synonymous substitutions between these two species given the calculated synonymous substitution rate from Question 1, the time of divergence, and the number of generations per year. Provide an explanation for why there is a discrepancy between the observed and expected values, continuing to assume that the mutations are completely neutral. (Hint: Consider what you know about substitution patterns.)
Based on 3 × 10⁻⁷ synonymous substitutions per generation for the entire exon, 270 substitutions are expected (90,000,000 years × 2 lineages × 5 generations/year x 0.0000003 synonymous substitutions/generation). This is much higher than is the 174 observed synonymous substitutions between these two species. A likely explanation for the discrepancy is that not all of the actual substitutions are observed due to multiple, coincident, parallel, and back substitutions.
4.
Calculate the average per-
There are, on average, 18 nonsynonymous substitutions between D. ananassae and the other species. Given 36 million years of evolution, 500 nonsynonymous sites, and 5 generations per year, the per-
5.
Suppose a biologist asserts that this transcription factor is actually a pseudogene in flies. Based on the information you have obtained, do you agree with this biologist? Why or why not?
The biologist is likely incorrect, and the gene is likely to still be a functional gene and not a pseudogene. Because they have lost function, pseudogenes are unlikely to be affected by selection. Thus, nonsynonymous sites should have substitution rates equal to or higher than the synonymous substitution rate, which is not what is observed.