Blood flows from right heart to lungs to left heart to body
The superior (upper) vena cava and the inferior (lower) vena cava (see Figure 49.2) are the large veins that return deoxygenated blood to the right atrium from the upper and lower body, respectively. The veins of the heart itself also drain into the right atrium. From the right atrium, the blood flows through the tricuspid valve into the right ventricle. The filling of the ventricle is mostly passive flow while the heart is relaxed between beats. At the end of this phase of passive ventricular filling, the atrium contracts and adds a little more blood to the ventricular volume. The right ventricle then contracts, causing the tricuspid valve to close and pumping the blood into the pulmonary artery leading to the lungs.
Pulmonary veins return the oxygenated blood from the lungs to the left atrium, from where the blood enters the left ventricle through the bicuspid valve. As on the right side of the heart, most left ventricular filling is passive, and is only topped off when the atria contract.
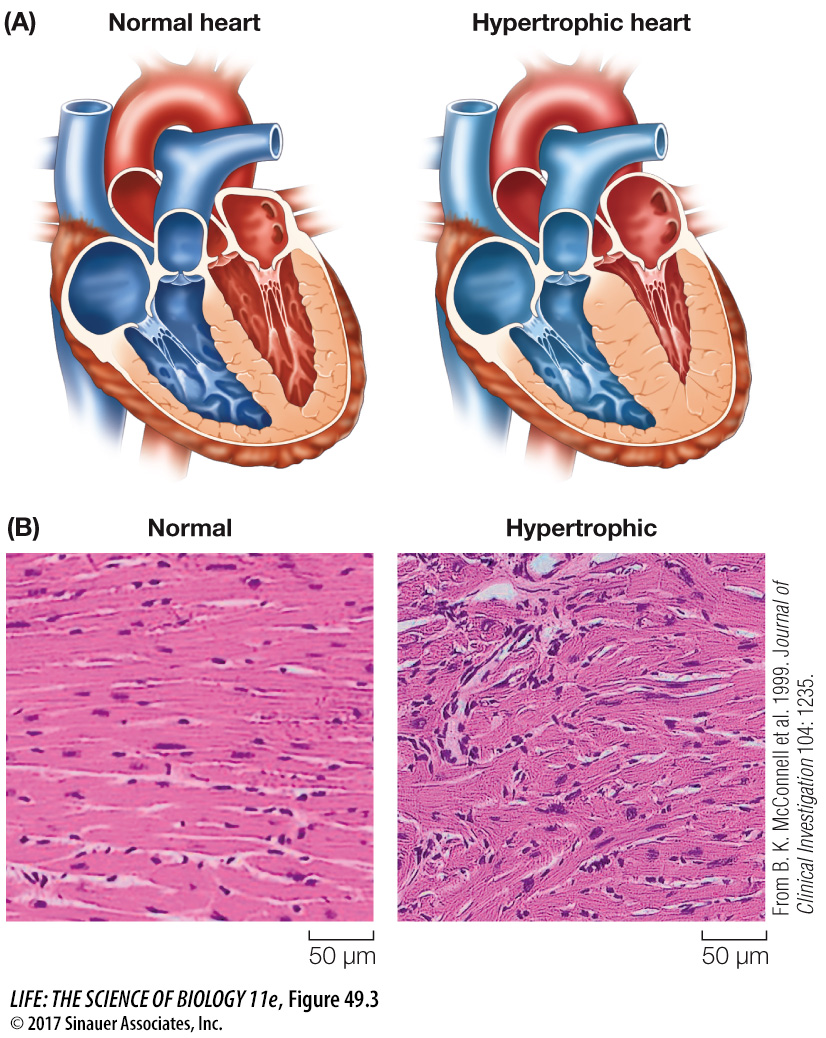
The walls of the ventricles are powerful muscles that contract around the blood with a wringing motion starting from the bottom. When pressure in the left ventricle is high enough to push open the aortic valve, blood rushes into the aorta to begin its circulation throughout the body. In Figure 49.2 observe that the walls of the left ventricle are thicker than those of the right ventricle. The left ventricle has to propel blood through many more kilometers of blood vessels than does the right ventricle, and must therefore push against more resistance, even though both ventricles pump the same volume of blood.
It is the left ventricle that creates the condition of hypertrophic cardiomyopathy (HCM) that you learned about at the beginning of this chapter. Mutations that reduce the efficiency of contraction of the cardiac muscle result in the work load of the left ventricle being greater than normal, so the ventricular muscle compensates by getting bigger (hypertrophy). When the heart is repeatedly stressed by high levels of activity, as is common in athletes, the hypertrophy can become extreme (Figure 49.3). The consequences can be blockage of blood flowing into the aorta and disruption of the signals that coordinate the contractions of the ventricular muscles.
Both sides of the heart contract at the same time. Contraction of the two atria, followed by contraction of the two ventricles and then relaxation, is the cardiac cycle. The cardiac cycle is divided into two phases: systole (pronounced sís-
focus: key figure
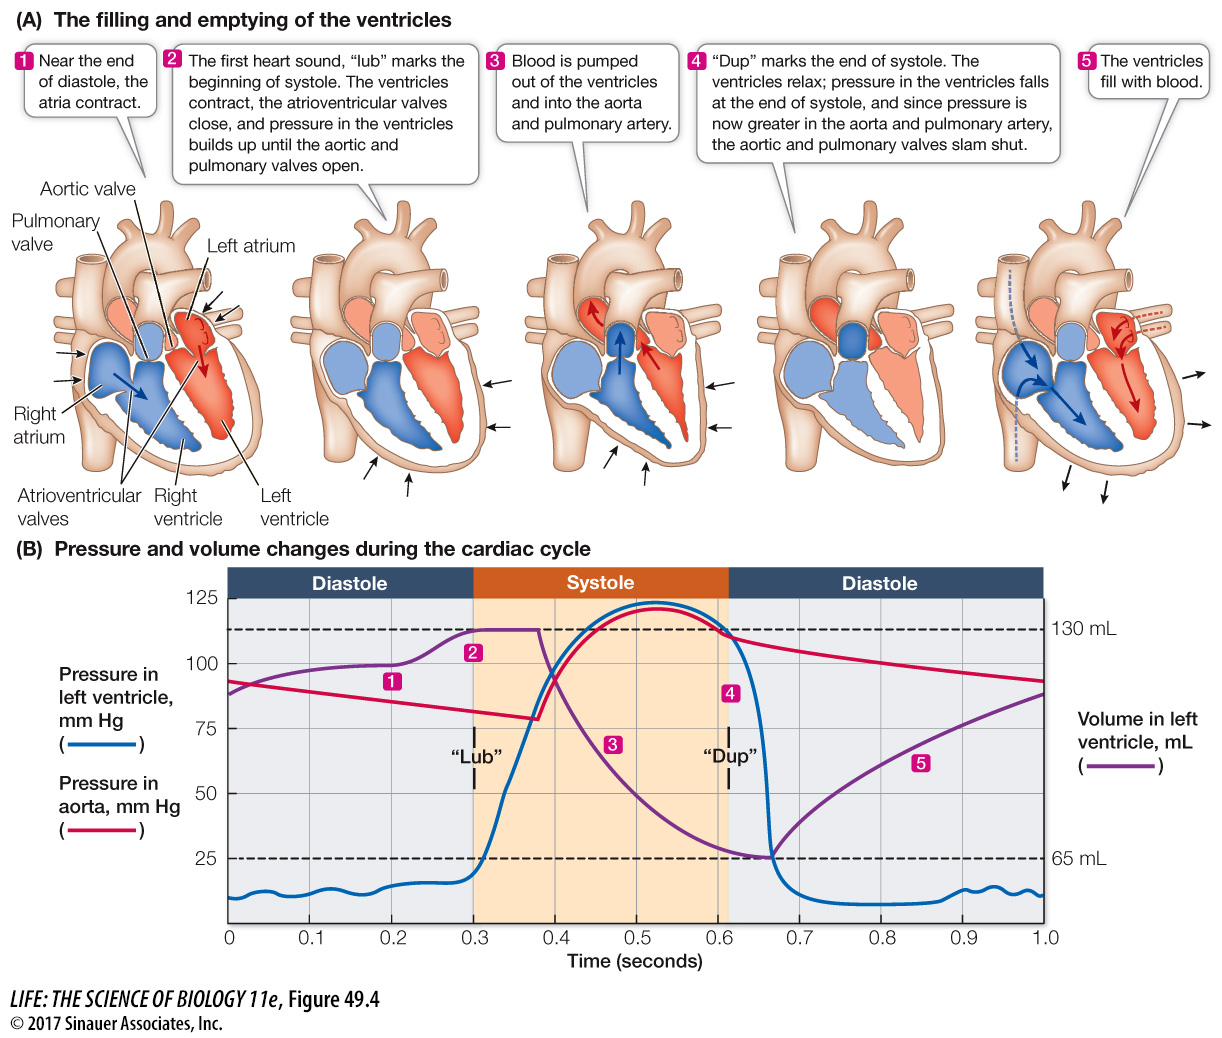
Q: If these curves were for the right ventricle instead of the left ventricle, how would they differ and how would they be the same?
If these curves were for the right ventricle, the volume curve would be the same, but the pressure curves during systole would be lower.
Animation 49.1 The Cardiac Cycle
The sounds of the cardiac cycle—
Defective valves that do not close completely produce turbulent blood flow and the sounds known as heart murmurs. For example, if an AV valve does not close completely, blood will flow back into the atrium with a “whoosh” at the beginning of systole.
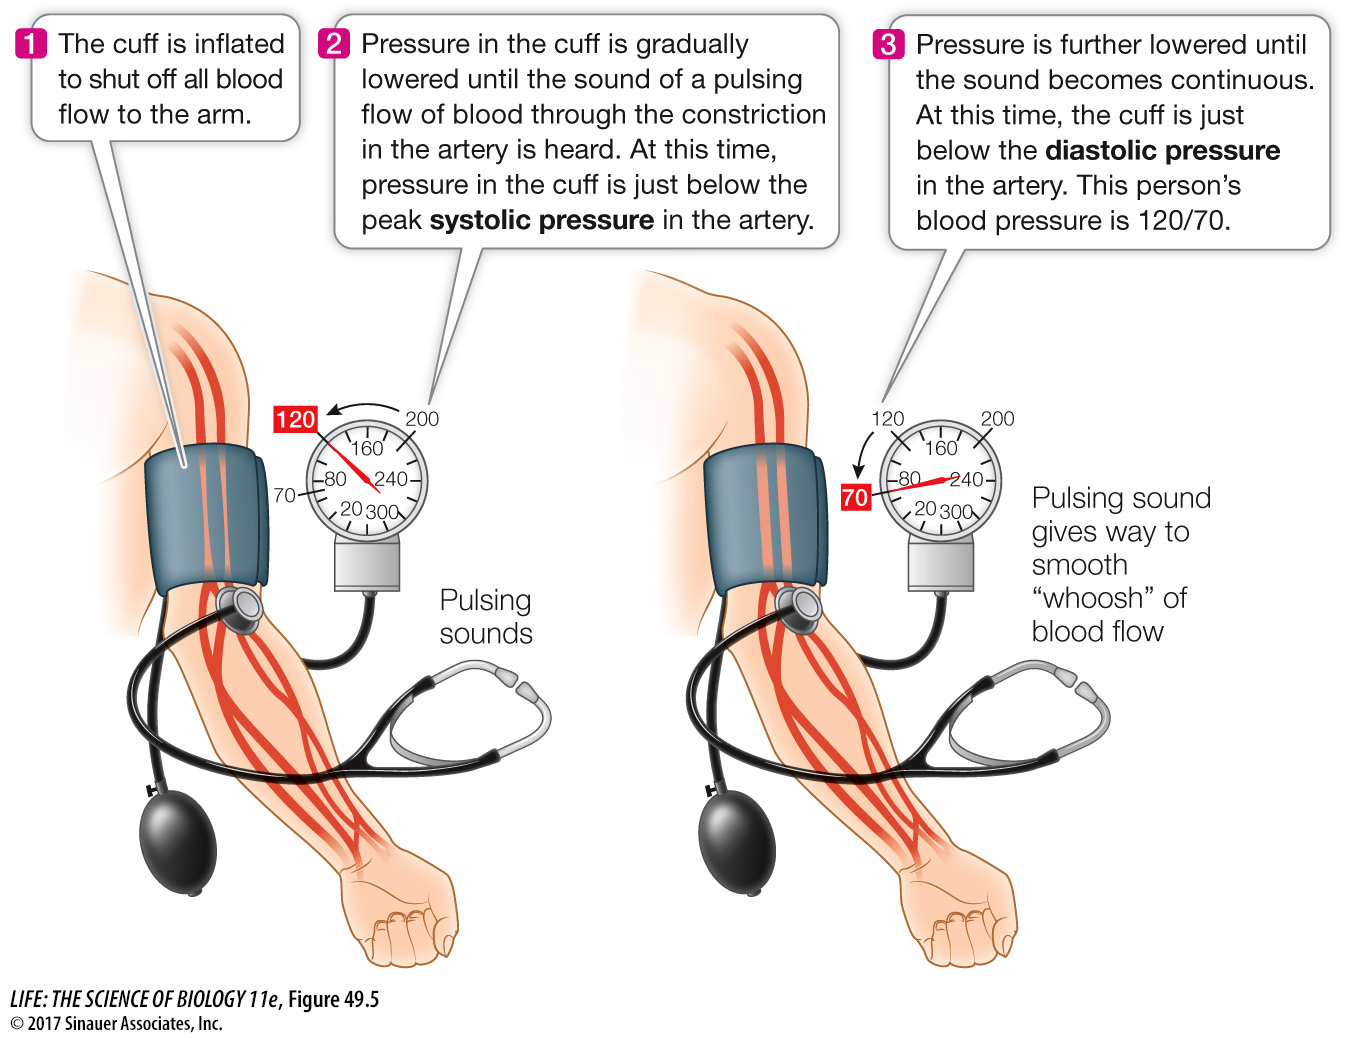
Blood pressure changes associated with the cardiac cycle can be measured in the large artery in your arm by using an inflatable pressure cuff and a pressure gauge, together called a sphygmomanometer, and a stethoscope (Figure 49.5). This method measures the minimum pressure necessary to compress an artery so blood does not flow through it at all (the systolic pressure) and the maximum pressure that allows continuous flow through the artery (the diastolic pressure). A conventional blood pressure reading is expressed as the systolic pressure placed over the diastolic pressure. Healthy values for a young adult might be 120 millimeters of mercury (mm Hg) during systole and 70 mm Hg during diastole, or 120/70. Modern blood pressure measuring devices such as you might encounter in a drugstore are automated so that the stethoscope is unnecessary.