recap
54.2 recap
Population growth is the change in population size over time, as reflected by the number of births, deaths, and migrants in and out of the population. Exponential (multiplicative) growth occurs when the per capita growth rate, r, is constant over time. Logistic growth occurs in an environment in which resources are limited and a population reaches its carrying capacity, K. Factors limiting population growth can be density-
learning outcomes
You should be able to:
Write an equation for population size at time t, and explain each of the terms of the equation.
Distinguish between density-
dependent and density- independent factors in population growth, and give examples of each. Interpret a life table, and explain and calculate the types of information it can provide about a population.
1.
Write an equation that describes how births, deaths, immigration, and emigration affect population size. Define each variable.
Nt = N0 + (B – D) + (I – E)
Nt = population size at time t; N0 = population size at time 0; B = number of individuals born between time 0 and time t: D = number of individuals that died between time 0 and time t; I = number of individuals that immigrated between time 0 and time t; E = number of individuals that emigrated between time 0 and time t.
2.
Suppose you are asked to predict what the population size of an endangered bird will be in 2035.
Complete the cohort life table below, and calculate the R0, G, and r of this cohort.
Calculate what the population size, Nt, of this cohort will be in 2035, assuming exponential population growth and N0 = 120.
To add more realism to these calculations, suppose that K (carrying capacity) = 300 for this cohort. What will the population size be, assuming logistic growth, in 2035?
| Year | Age (x) |
Number of female birds (Nx) |
Number of female offspring (Nx offspring) |
Survivorship (lx) |
Fecundity (mx) |
lx mx | x lx mx |
|---|---|---|---|---|---|---|---|
| 2012 | 0 | 100 | 0 | ||||
| 2013 | 1 | 50 | 75 | ||||
| 2014 | 2 | 40 | 80 | ||||
| 2015 | 3 | 30 | 60 |
a.
| Year | Age (x) | Number of female birds (Nx) | Number of female offspring (Nx offspring) |
Survivorship (lx) | Fecundity (mx) | Net reproductive rate (lx mx) | Generation time (x lx mx) |
|---|---|---|---|---|---|---|---|
| 2012 | 0 | 100 | 0 | 0 | 0 | 0 | 0 |
| 2013 | 1 | 50 | 75 | 0.50 | 1.50 | 0.75 | 0.75 |
| 2014 | 2 | 40 | 80 | 0.40 | 2.00 | 0.80 | 1.60 |
| 2015 | 3 | 30 | 60 | 0.30 | 2.00 | 0.60 | 1.80 |
| R0 = 2.15 | 4.15 |
R0 = 2.15; G = 4.15/2.15 = 1.93; r = ln (2.15)/1.93 = 0.40.
b. Nt = (120) e 0.40 × 20 = (120)(2,982) = 357,720.
c. Nt = 300/(1 + [(300 – 120)/120] e–0.40 × 20) = 300/1.0005 = 300.
3.
Plot the number of birds surviving with age for the cohort in Question 2. What type of survivorship curve does this cohort have?
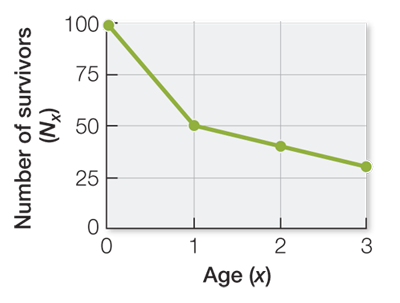
This cohort has a type II survivorship curve, which is typical for birds, fish, and plants.
4.
Describe some density-
Density-
Life tables reflect the ways in which organisms partition their time and energy among growth, maintenance, and reproduction. Comparisons across individuals, populations, and species reveal different patterns of partitioning, which allow organisms to cope with different environmental challenges. Let’s move on to discuss how life history traits arise and the types of strategies organisms employ.