Apply What You've Learned
Review
55.1
Broad categories of species interactions are predation, competition, positive interactions, and amensalism.
55.1
Species interactions are often dynamic and asymmetrical; that is, species have unequal effects on one another.
Original Paper: Bartomeus, I., J. S. Ascher, D. Wagner, B. N. Danforth, S. Colla, S. Kornbluth et al. 2011. Climate-
Rising global temperatures due to climate change affect the timing of natural events, including insect pollination and other species interactions. As temperatures rise, these events happen earlier. Not all species react to these changes in similar ways, and this can result in timing mismatches. For example, if the timing of insect emergence varies too much from that of flowering, pollination may not occur.
Scientists looked at 3,447 museum specimens of native bee species dating back to the 1870s. They chose 10 bee species that are known to range across North America, emerge in early spring, and pollinate both crops and wild plants. The scientists then compared the predicted pollination date for individual bees with flowering times of bee-
Figure A shows scatter plots of the distribution of predicted pollination dates for individual bees between 1870 and 2010 (top) and the mean April air temperature between 1900 and 2010 (bottom). Predicted pollination date is the number of days between January 1 and the bee-
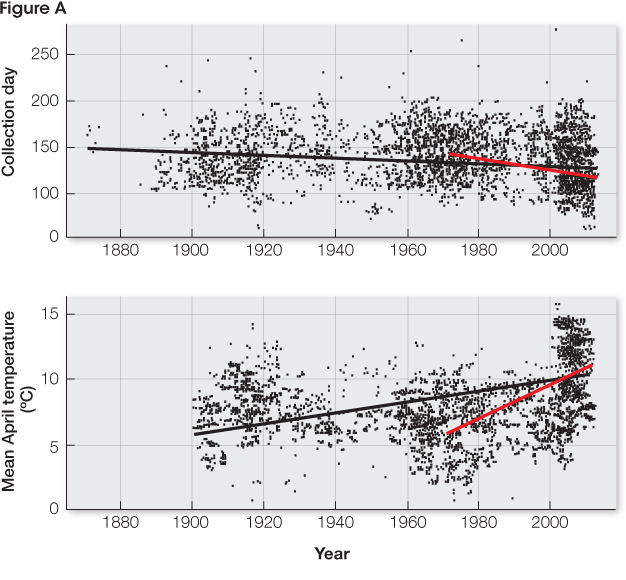
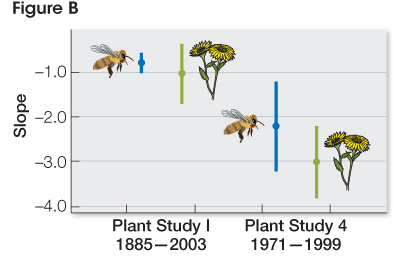
Figure B shows comparisons of the change in days for bee pollination time and plant flowering time for two time intervals. The change in slope between the two dates (bees at left, plants at right) indicates the degree of difference between bee pollination time and plant flowering time for both time intervals. The interval indicates a mismatch of 4−6 days over the 118-
Questions
1.
Characterize the type of interaction occurring between plants and bees, and explain why it is necessary for the timing of bee emergence and plant flowering to be closely correlated.
Pollination is a positive interaction, or facilitation. Specifically, it is a mutualism, meaning both partners benefit. Bees obtain food (pollen and nectar) from plants. Plants rely on bees for pollination, which is necessary for successful reproduction. For a successful pollination interaction, bees must emerge at the same time that plants flower.
2.
Explain and analyze the trends shown in the two plots of Figure A. What has happened over time to the trend in bee pollination date and the trend in mean April air temperature? Why are these two trends moving in opposite directions? What is the significance of the difference in slope of the entire time period versus the shorter time period after 1970?
Over time, the trend in bee pollination date is slightly downward, indicating that the bees were pollinating slightly earlier in the year. The mean April temperature showed an upward trend, indicating that temperatures rose over the time period. The opposing directions of the trends indicate that as temperatures rose, bees were pollinating earlier in the year. The steeper slope after 1970 on both graphs suggests that temperature has increased faster since 1970. Statistical analysis bears this out; 69 percent of the bees’ advance in pollination activity has occurred since 1970.
3.
Describe differences in the trends shown in the two studies in Figure B, and indicate which study best supports the hypothesis that climate warming is affecting plant–
The recent study (1971-
4.
The bees in these studies are generalist species; that is, they feed on (and pollinate) many species of plants, as compared with specialists, which associate with one or a few closely related species. Do you think specialist plant–
Specialist plant-
5.
This is one of few studies conducted to date on the effect of climate change on plant–
There are many possible designs, but more precise information would require analysis of specific plant-
Go to LaunchPad for the eBook, LearningCurve, animations, activities, flashcards, and additional resources and assignments.