Patterns of primary production vary with latitude and ecosystem type
Large-scale geographic variation in primary production is one of the most obvious ecological patterns on Earth. Only recently, however, have ecologists been able to reliably quantify patterns of productivity at global scales. Satellite-based optical sensing techniques now help scientists detect the amount of primary production on land and in the ocean at global scales. How do terrestrial and oceanic ecosystems compare, and how is NPP distributed across the globe?
Page 1230
Estimates of global NPP show that the total amount of carbon taken up by terrestrial ecosystems (52%) is slightly higher than that taken up by the oceans (48%), even though oceans make up a greater percentage (70%) of Earth’s surface. This difference arises because terrestrial ecosystems have a much higher per-area NPP (426 g C/m2/year) than do oceans (140 g C/m2/year).
Satellite imaging has also shown that NPP is distributed differently on land than in the ocean. NPP on land varies dramatically with latitude, whereas oceans show much less latitudinal variation (Figure 57.2). On land, NPP is highest in the tropics and declines at higher latitudes. Arid regions such as those in deserts (30° latitude) and at the poles (90° latitude) show extremely low NPP (Figure 57.3A). NPP rises slightly at mid-latitudes, especially in the Northern Hemisphere, where land area is larger than in the Southern Hemisphere (see Figure 57.2). In the oceans, NPP is highest at mid-latitudes and along coastal zones, especially those that experience upwelling (Figure 57.3B). NPP is also higher in the Southern Hemisphere, where ocean area is larger than in the Northern Hemisphere (see Figure 57.2).
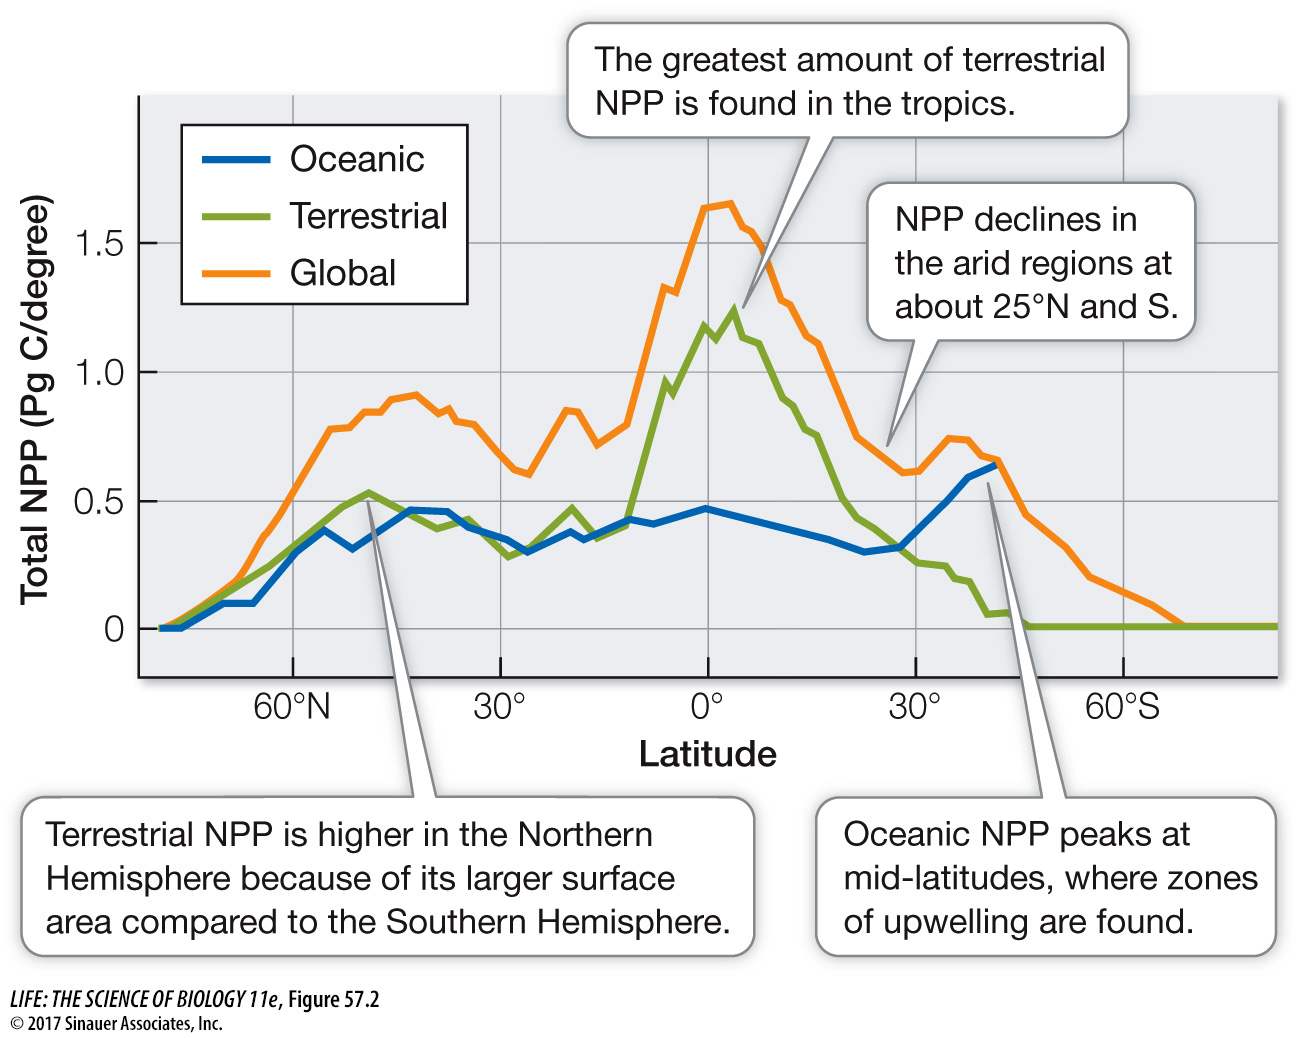
Figure 57.2 Estimates of Total Oceanic, Terrestrial, and Global NPP by Latitude On land, NPP is highest in the tropics and declines at higher latitudes. In the oceans, NPP does not vary much with latitude except at mid-latitudes, especially in the Southern Hemisphere. (1 petagram or Pg = 1015 g).
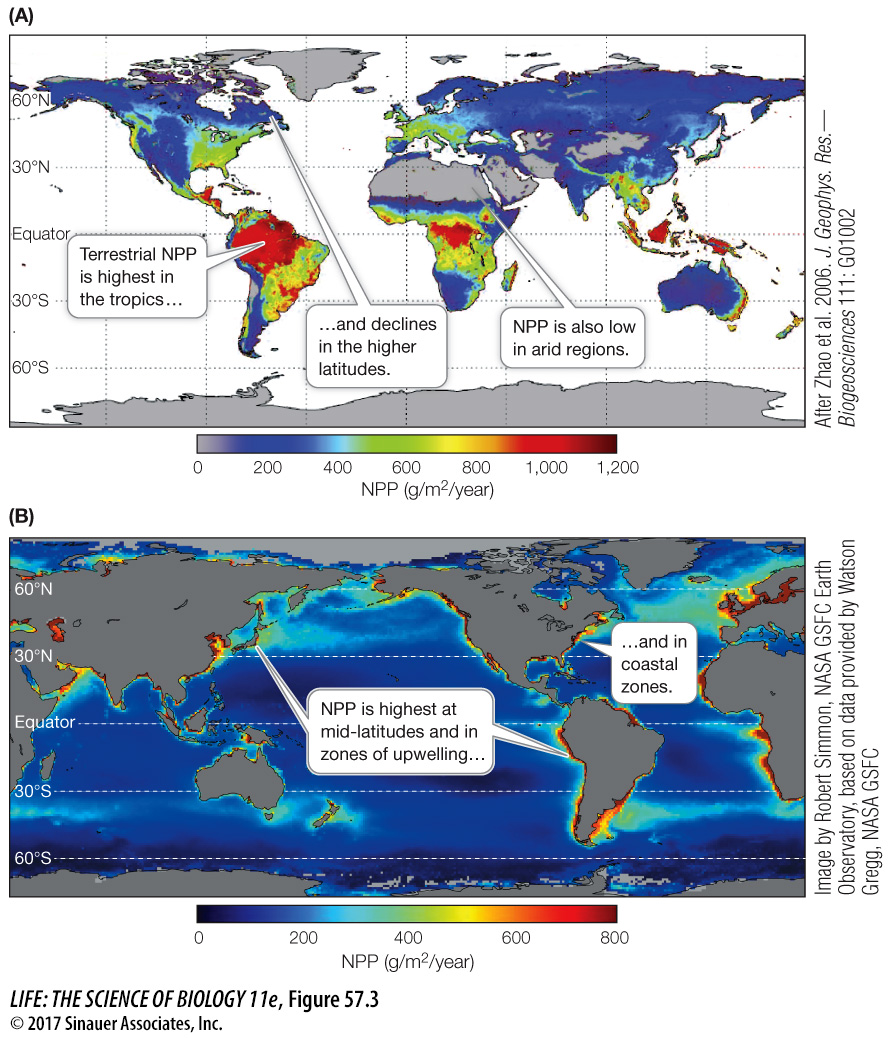
Figure 57.3 Geographic Variation in Terrestrial and Oceanic NPP Maps of NPP based on satellite sensor data. (A) Terrestrial NPP is highest in the tropics and lowest in arid regions and at the poles. Gray areas represent unvegetated land masses, including deserts and ice caps. (B) Oceanic NPP is highest at mid-latitudes and in coastal and upwelling zones.
Remote sensing has also revealed variation in NPP among different ecosystem types or biomes. Tropical rainforest ecosystems have the second-highest average and net NPP, even though they make up only a little over 3 percent of Earth’s surface (Figure 57.4). In comparison, the open ocean ecosystems have a low average NPP, despite the large area over which they occur. Some marine ecosystems such as estuaries and algal beds and coral reefs have some of the highest average net primary productivity, but their small geographic areas make their contributions to global NPP modest. It is important to note, however, that the primary producers in these ecosystems contribute substantially to local and regional NPP and thus are critical to marine food webs.
Page 1231
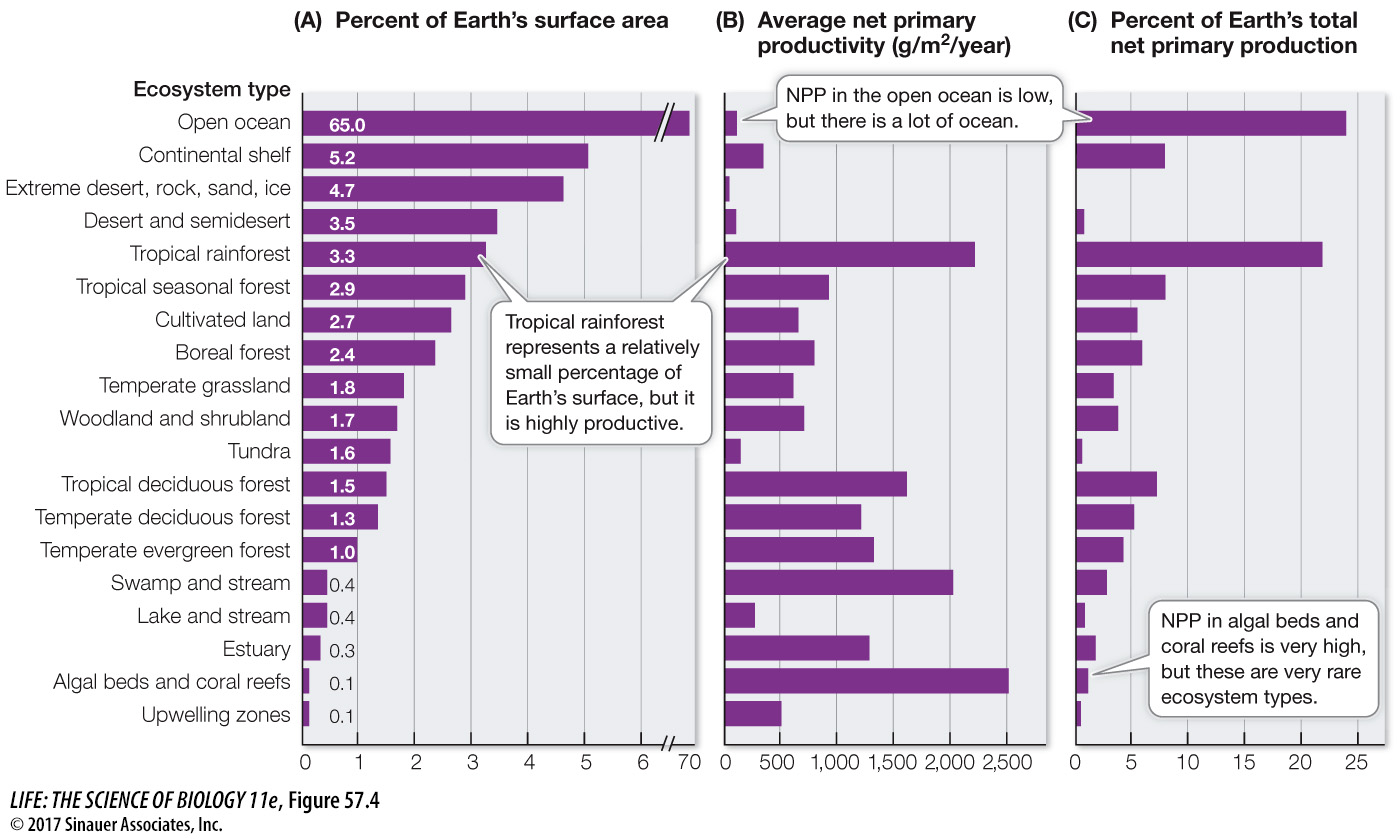
Figure 57.4 Ecosystems Differ in NPP The contribution of different ecosystem types to global NPP can be measured by (A) their geographic extent and (B) their average net primary productivity. (C) Combining these two measures gives the proportional contribution of each ecosystem type to Earth’s total NPP.
Not surprisingly, the patterns of primary production that we see on land versus ocean, and among ecosystem types, can be explained by separate factors that control primary production in terrestrial versus aquatic systems. We will now consider these factors in more detail—first on land, and then in oceans and lakes.