Chapter 23
RECAP 23.1
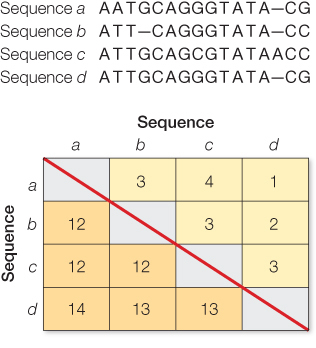
A simple count of nucleotide differences misses multiple substitutions, including coincident substitutions, parallel substitutions, and back substitutions (see Figure 23.2). Evolutionary models can be used to estimate the number of multiple substitutions that have occurred, based on the number of actual differences that are observed. For example, the second nucleotide of Sequences a and b from Question 1 exhibits a single difference between an A and T. Although a single substitution from a T to an A in Sequence a could explain this difference, it is also possible that there were two substitutions (e.g., first a substitution from T to C, then another from C to A). A simple count of differences misses such multiple substitutions.
RECAP 23.2
This problem can be investigated by sequencing and comparing the genes for opsins in surface-
dwelling (eyed) and cave- dwelling (eyeless) crayfish. If the genes of the eyeless species are no longer under any selection, we would expect to observe a similar rate of synonymous and nonsynonymous substitutions in the genes. If there has been strong selection for a new function (something other than vision), we would expect a higher rate of nonsynonymous substitutions compared with synonymous substitutions (indicating positive selection). We would compare the rates observed in the eyeless species to the rates seen in the surface- dwelling (eyed) species. In the surface- dwelling species, we would expect to see a higher rate of synonymous compared with nonsynonymous substitutions, which is expected under purifying selection. A given neutral mutation will arise more often in a large population than in a small population, but any mutation that does arise is more likely to be fixed in a small population than in a large population. These two influences of population size exactly cancel each other out, so that overall, the rate of fixation of neutral mutations depends only on the mutation rate and is independent of population size.
In a diploid population of size N and a neutral mutation rate μ per gamete per generation at a locus, the number of new mutations would be, on average, 2Nμ, because 2N gene copies are available to mutate. The probability that a given mutation will be fixed by drift alone is its frequency, which equals 1/(2N) for a newly arisen mutation. We can multiply these two terms to get the rate of fixation of neutral mutations (m) in a given population of N diploid individuals:
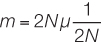
But we can simplify this equation by canceling out 2N on the right side of the equation:
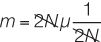
This just leaves m = μ In words, the rate of fixation of neutral alleles is equal to the mutation rate of neutral alleles and independent of population size.
Codon numbers 12, 15, and 61 are likely to be evolving under positive selection for change because each of these codons has experienced a higher rate of nonsynonymous substitutions (which give rise to amino acid replacements) than synonymous substitutions.
Codon numbers 80, 137, 156, and 226 are likely evolving under purifying selection, as the vast majority of changes at these codons are synonymous substitutions, which do not result in amino acid replacements. Substitutions that result in amino acid changes (nonsynonymous substitutions) undoubtedly occur but are usually selected against in the population. Codon number 165 has experienced similar numbers of synonymous and nonsynonymous substitutions. There are approximately three times as many possible nonsynonymous substitutions as there are synonymous substitutions. Therefore the number of synonymous substitutions is slightly higher than expected if the rates of each type of substitution are equal. Codon 165 may be evolving under weak purifying selection; it is the codon that is closest to neutral among the codons shown in the table.
Example hypothesis 1: Genome size varies primarily because noncoding DNA can effect changes in gene expression, and many species have evolved largely through changes in gene expression.
Example hypothesis 2: Genome size varies primarily as a function of population size. Species with small population sizes may accumulate large amounts of noncoding DNA because of weak selection against accumulation of slightly deleterious “junk” DNA in small populations.
Contrasting the two hypotheses: If hypothesis 1 explains most of the variation in genome size among organisms, then we would expect genome size to be largely independent of population size, which is not the case. For example, Figure 23.9 indicates that the species with the largest genomes, like the lungfish, generally have much smaller population sizes than the species with the smallest genomes, like the E. coli or yeast. However, both hypotheses may explain some of the variation in genome size, and careful, controlled experiments would be needed to determine how much of the variation in genome size is explained by the effects of selection (hypothesis 1) versus population size (hypothesis 2).
RECAP 23.3
New genes can add new functions. For example, lateral transfer of a gene that confers antibiotic resistance would provide a huge advantage to bacteria that are subjected to antibiotics.
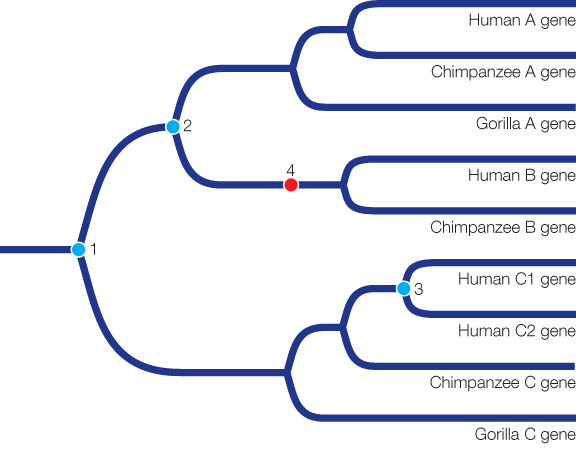
The tree indicates that three gene duplication events and one gene loss occurred. In the tree below, the three gene duplication events are marked in blue, and the gene loss is marked in red. Gene duplication event 1 marked the duplication between gene C and the ancestor of genes A and B. Gene duplication event 2 resulted in genes A and B. Gene duplication event 3 happened in the ancestor of humans and resulted in human genes C1 and C2. Finally, there was a loss of gene B in gorillas (event 4 on the tree).
Gene duplication provides the raw material for much of evolution. A duplicated gene is free to diverge from its ancestral function, since the original copy of the gene can continue to provide the original function.
- Page A-25
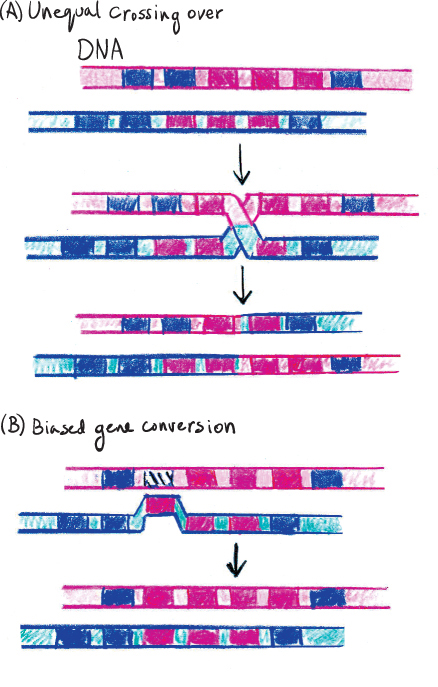
Concerted evolution refers to highly repeated gene families where all the copies evolve together so that all the copies maintain a high degree of similarity. Two processes can produce concerted evolution: unequal crossing over and biased gene conversion. The two processes differ as follows:
RECAP 23.4
Comparisons of evolutionary changes in proteins, made across species in which these proteins differ in function, provide insight into how change in protein sequence relates to change in protein function. For example, changes across many different genes in many different species of puffer fish show which changes are related to the evolution of tetrodotoxin resistance in sodium channel genes. These studies help us understand the function of sodium channels, which helps us understand the genetic basis of various neurological pathologies.
Starting with a large pool of random sequences, in vitro evolution involves rounds of selection and mutation to produce new molecules with specific functions. This corresponds exactly to the processes of mutation and natural selection in natural populations. The only difference is that the selection and mutational processes are controlled by humans in a laboratory setting, to produce a molecule with a desired function.
Most emerging diseases are caused by living, evolving organisms. Evolutionary comparisons of DNA sequences from these pathogens allow quick identification and often reveal the source of the disease (from a particular host species or geographical area). Previously unidentified pathogens can be compared with their closest relatives. This often allows biologists to make predictions about the best strategies for controlling the spread of the disease.
WORK WITH THE DATA, P. 494
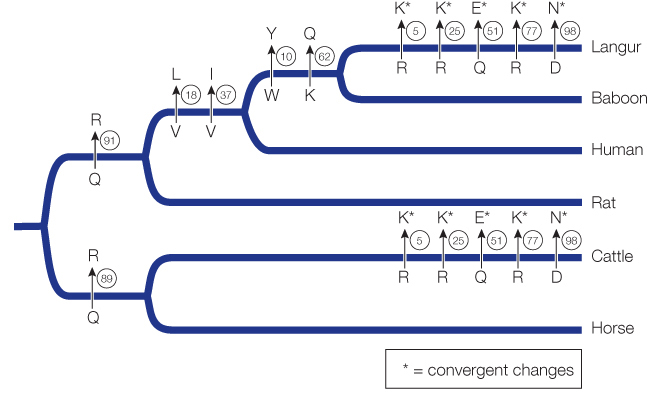
Positions 14, 21, 50, 75, and 87 show convergence in amino acids between cattle and langur.
Position 17 is convergent between cattle and the ancestor of langurs and baboons.
No, there are no other convergent changes. The fact that almost all convergent events occur between cattle and langurs supports the hypothesis that these convergent changes are related to the convergence in function associated with a shift to foregut fermentation.
WORK WITH THE DATA, P. 503
Birds appear to be the original source of influenza viruses that now cause flu in the various mammal species (horses, pigs, and humans). The bird lineages extend to the base of the tree, and appear to be closely related to each lineage of influenza virus that occurs in a mammal.
The tree shows five cross-
species transmissions: two from birds to horses, two from birds to pigs, and one from birds to humans. The human flu viruses are most closely related to viruses in pigs (hence the common name “swine flu”), and it is possible that the virus was transferred from birds to pigs and then from pigs to humans in a short period of time late in the second decade of the 1900s. In 1918, a new strain of influenza had just entered human populations (as well as pig populations). Humans’ immune systems would not have had any prior experience with this new strain of influenza, and so would not have been prepared for an effective defense.
Earlier flu cases were likely caused by other cross-
species transfers of different strains of influenza into human populations. Those flu strains appear to have been eliminated from human populations, and so were not available for sampling in this study (and therefore do not appear on the tree).
FIGURE QUESTIONS
Figure 23.10 Approximately 100 million years ago.
Figure 23.12 Two gene duplication events were restricted to the zebrafish lineage: the event that gave rise to the zebrafish En1a and En1b genes, and the event that gave rise to the zebrafish En2a and En2b genes.
APPLY WHAT YOU’VE LEARNED
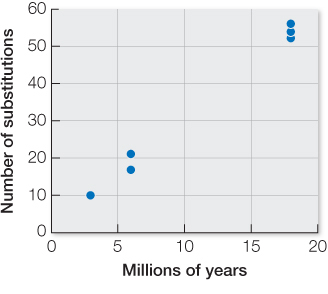
There are, on average, 54 synonymous substitutions between lineages that diverged 18 million years ago (36 million years of evolution altogether). Thus, there have been about 1.5 synonymous substitutions per million years for the entire exon. Given five generations per year and 600 synonymous sites, the rate is 3 × 10⁻⁷ synonymous substitutions per generation for the entire exon and 5 × 10⁻¹⁰ synonymous substitutions per site.
The per-
site synonymous substitution rate is 5 × 10⁻¹⁰ (from Answer 1 above). If all synonymous substitutions are neutral, the substitution rate should equal the mutation rate. Based on 3 × 10⁻⁷ synonymous substitutions per generation for the entire exon, 270 synonymous substitutions are expected (90,000,000 years × 2 lineages × 5 generations/year × 0.0000003 synonymous substitutions/generation). This is much higher than the 174 observed synonymous differences between these two species. A likely explanation for the discrepancy is that not all of the actual substitutions are observed, because of multiple, coincident, parallel, and back substitutions.
There are, on average, 18 nonsynonymous substitutions between D. ananassae and the other three species. Given 36 million years of evolution, 2000 nonsynonymous sites, and five generations per year, the per-
generation, per- site nonsynonymous substitution rate is 5 × 10–11. This is one- tenth the synonymous rate of 5 × 10⁻¹⁰ calculated in Question 1. This much- lower nonsynonymous rate suggests strong purifying selection. The biologist is probably incorrect, and the gene is likely to still be a functional gene and not a pseudogene. Because they have lost function, pseudogenes are unlikely to be affected by selection. Thus, nonsynonymous sites of pseudogenes should have substitution rates about the same as those of synonymous sites, which is not what is observed.