Chapter 39
RECAP 39.1
Cells are limited in size by whether their surface area is sufficient to meet their metabolic needs by diffusion and transport of nutrients and wastes across the cell membrane.
The major advantage of being multicellular is that every cell does not have to provide for all of its metabolic needs. Different cells can become specialized to perform specific functions that contribute to the survival and health of the whole organism. With that specialization comes greater efficiency. Also, multicellularity avoids the problem of the decreasing surface area-
to- volume ratio that accompanies an increase in size of the organism. A third advantage is that bigger organisms can more easily avoid predation and in turn prey on smaller organisms. The gut is a good example of how multiple tissue types contribute to the structure and function of an organ. Epithelial tissues provide the boundary between the gut and its lumen where food is digested, and also provide transport mechanisms for the uptake of nutrients. Muscle tissues provide the motility necessary to move the gut contents from mouth to anus. Nervous tissues control motility of the gut and also provide sensory information used to control gut functions. Connective tissues give structural integrity to the gut, and one connective tissue—
blood— carries nutrients absorbed from the gut to all the other cells of the body.
RECAP 39.2
Maintenance of the internal environment is the primary focus of physiology of multicellular animals because the internal environment serves the needs of all the cells of the body. Cell types are specialized to contribute something to the maintenance of the internal environment, but no cell can provide for all of its own needs and therefore cannot exist alone.
Negative feedback is information about the regulated variable that can be compared to a set point to generate an error signal. The error signal is relayed to effector organs to bring the regulated variable back to the set point. Positive feedback is information about the regulated variable that can be converted to command signals that push the regulated variable farther from its set point. Feedforward information changes the set point in anticipation of an imbalance so that the regulated variable can remain stable as conditions change.
You would inject known volumes (V1) of mannitol and Evans blue at known concentrations (C1) into the blood of a subject. After a sufficient amount of time for the injected solutions to circulate around the body, you would take a blood sample and measure the concentrations of Evans blue or mannitol in the blood plasma (C2). You can then use the formula given for calculating V2 for mannitol, which will be the extracellular volume, and V2 for Evans blue, which will be the blood plasma volume. Subtracting the blood plasma volume from the ECF volume will give the interstitial fluid volume.
RECAP 39.3
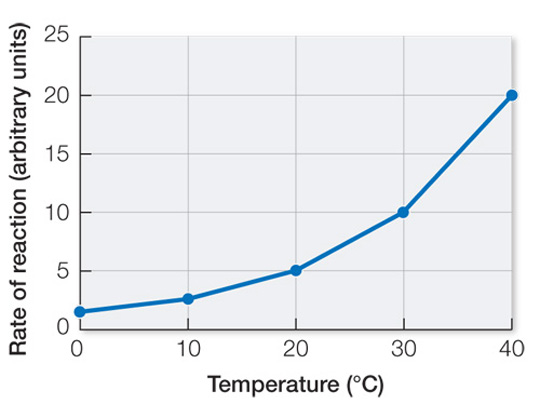
Fluctuations in body temperature can disrupt complex physiological processes because different steps or components of those processes are likely to have slightly different Q10 values. As a result, a temperature change can alter the integration of those steps or components.
Isozymes can have different temperature optima, so expressing different isozymes that have temperature optima that match seasonal changes in the climate can result in seasonal acclimatization.
RECAP 39.4
In nature, the ectotherm can use behavioral adaptations such as basking and seeking shade to prevent significant changes in its body temperature. In the laboratory, it does not have the opportunity to bring those adaptations into play.
The animal gains heat from radiation, convection, or conduction if the environment is warmer than the surface temperature of the animal, and the animal loses heat if the environment is cooler than the surface temperature of the animal. Evaporation can only result in a loss of heat from the animal, and the magnitude of the loss depends on the amount of water that is evaporated on a heat exchange surface such as skin or respiratory passages.
In fishes, the blood leaving the heart goes to the gills, where it comes into temperature equilibrium with the surrounding water. In most fish, that blood flows down the center of the fish through a large vessel leading to lots of smaller vessels that perfuse the tissues of the fish, thus cooling those tissues. In “hot” fishes, the major blood flow from the gills is through peripheral vessels that give rise to smaller segmental vessels going into the muscle tissue. The vessels carrying blood in (arteries) run parallel and close to the vessels carrying blood out (veins). The veins carry heat produced in the muscle, but because of this countercurrent flow of blood in the arteries and veins, the heat from the venous blood warms the arterial blood flowing into the muscle, thus decreasing the loss of heat from the muscle tissue. Countercurrent heat exchange in “hot” fishes acts to keep the heat generated by the powerful swimming muscles in the muscle tissue.
RECAP 39.5
Within the thermoneutral zone, metabolism can remain at basal levels because the regulation of body temperature can be achieved by passive means such as changing blood flow to the skin and changing posture. However, as environmental temperature falls, a point will be reached when active thermoregulation is required, resulting in an increase in metabolism. This point is the lower critical temperature. Conversely, as the environment warms, a point will be reached when increasing blood flow to the skin and changing posture will not prevent a rise in core temperature, and active mechanisms such as sweating or panting are required, resulting in a rise in metabolism. This point is the upper critical temperature.
The segment of the metabolic rate curve in Figure 39.16 that falls below the lower critical temperature (low end of the thermoneutral zone) represents the amount of heat production necessary to balance the amount of heat loss to the environment. That segment of the metabolic rate curve can be described by the equation shown. If there were no metabolic functions other than balancing heat loss, the heat loss and therefore the MR would be zero when Tb – Ta equaled zero. Thus this MR line below the basal metabolic rate level projects to a Ta that is equal to Tb.
In the equation, the constant K stands for thermal conductance, which is the inverse of insulation. If the curve represented a desert versus a similar sized arctic animal, the curve would have a higher slope (K). The lower critical temperature would be higher for the desert versus the arctic species.
Page A-41Heat is lost from the surface of the body, so a bigger, stockier animal will have a lower surface area-
to- volume ratio than a smaller, slimmer animal. Thus, for closely related species, selection has favored larger, stockier variants in the colder latitudes. Feedforward information serves to change set points in anticipation of an upcoming stressor. For example, exposure to a cold environment can elevate the set point for metabolic heat production, so that the increased heat loss from the body to the cold environment is balanced without requiring a drop in core body temperature to trigger the response.
The mammalian thermostat is described as a proportional thermostat with an adjustable set point because the drive it generates to effector organs is proportional to the difference between hypothalamic temperature and a threshold hypothalamic temperature for activation of that response. The descriptor of adjustable set point refers to the role of feedforward information in altering the hypothalamic temperature thresholds for different thermoregulatory responses.
WORK WITH THE DATA, P. 832
Standardizing results to percent increases in treatments 1 and 2, averaging and calculating standard deviations for those two groups, comparing the two groups to determine if there is a possible order effect through use of a paired t-test.
Percent increase,
experiment 1Percent increase,
treatment 2Subject Control group
(no cooling)Treatment group
(palmar cooling)1 35.29 11.11 2 24.00 27.59 3 4.55 5.80 4 28.30 12.50 5 25.86 35.44 6 3.28 14.93 7 2.70 76.74 8 6.00 28.57 9 –5.26 28.95 Treatment group Control group 10 39.39 7.87 11 11.49 5.62 12 30.00 8.75 13 32.31 39.44 14 57.89 26.19 15 42.62 21.59 16 53.33 18.67 17 48.98 1.35 Mean 25.93 21.83 Standard deviation 18.80 17.53 The P-value (0.058) shows there is no significant difference between the two data sets and therefore there cannot be an order effect.
The standardized values (percent increases) are sorted according to treatment—
palmar cooling or no cooling. Means and standard deviations are calculated and a paired t-test is applied to the data. Subject Palmar cooling No cooling 1 11.11 35.29 2 27.59 24.00 3 5.80 4.55 4 12.50 28.30 5 35.44 25.86 6 14.93 3.28 7 76.74 2.70 8 28.57 6.00 9 28.95 –5.26 10 39.39 7.87 11 11.49 5.62 12 30.00 8.75 13 32.31 39.44 14 57.89 26.19 15 42.62 21.59 16 53.33 18.67 17 48.98 1.35 Mean 32.80 14.95 Standard deviation 18.54 12.88 The P value of < 0.008 is highly significant, indicating that the increases during the palmar cooling treatments were greater than the increases during the no cooling treatments.
The hypothesis that extracting excess heat from the body will increase the capacity of an individual’s muscles to do work is supported by these data. Normalizing the data to percent increases and then testing for order effects showed that there was no effect from whether the cooling or the control treatment came first. Testing for treatment effect, however, yielded a highly significant benefit to the cooling treatment.
FIGURE QUESTIONS
Figure 39.2 The muscles are connected to the bones and the bones are connected to each other by connective tissue. Bone is connective tissue, and without bones, the muscles would not be able to exert forces on the environment. Blood is also a connective tissue and supplies the muscles with oxygen and removes wastes and heat. Epithelial tissues line the blood vessels. Neural tissues carry the motor commands to control the contractions of the muscles.
Figure 39.8 The fall of the mouse’s temperature at cold environmental temperatures and its rise at high environmental temperatures indicates the limitations on the mouse’s ability to regulate its body temperature. At high environmental temperatures, the mouse’s metabolic rate rises because active heat loss (e.g., sweating, panting, or licking) requires energy.
Figure 39.12 The fact that both Arctic and tropical mammals fall on this same curve means that BMR has not evolved as an adaptation to climate. If the BMR of arctic mammals was elevated to counter increased heat loss to the environment, the data points for arctic mammals should fall above the curve and the data points for tropical mammals should fall below the curve.
APPLY WHAT YOU’VE LEARNED
The group that reached a body temperature of 30°C in a significantly shorter time was the +2°C group. The starting temperature did have an effect on the rate of rewarming, which was 4.9°C/hr for the +2°C group and 3.8°C/hr for the –12°C group.
When an animal’s body temperature is constant, there is a balance between heat entering the body and heat leaving the body.

Therefore for body temperature to rise, heatin has to be greater than heatout. For both groups of squirrels in this experiment, heatin can only be coming from a single source, metabolism, since neither group has any source of radiant heat to absorb. However, the squirrels in the –12°C group encounter a much lower ambient temperature. Although they experience little conductive, convective, or evaporative heat loss when sequestered in a closed chamber, the –12°C group could experience greater radiative heat loss, which is a function of the difference between an animal’s surface temperature and the ambient temperature. In addition, the –12°C group is starting the rewarming process at a lower Tb. Thus more metabolic heat must be generated by the –12°C group to reach a Tb of 30°C thus requiring a greater total metabolic output and a longer time.
The two primary generators of metabolic heat in mammals are shivering and nonshivering heat production. Shivering is the rapid cycling of contractions of antagonistic muscles that do no work on the environment, thus all of the energy released from ATP during this process is released as heat. Nonshivering heat production comes from brown fat. This tissue contains many mitochondria and a good blood supply (thus the brown color in comparison to white fat). The brown fat mitochondria contain a protein, thermogenin that uncouples the movement of protons from the production of ATP. Thus the fat substrate is metabolized, producing heat without producing ATP. These two mechanisms produce the heat to raise the body temperatures of the squirrels.