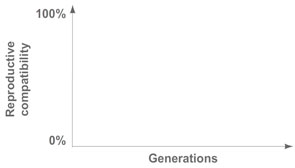
The following simulation shows how mutation rates affect the reproductive compatibility between two isolated lineages.
Instructions: Answer the question below. To manipulate the variables, input the number of generations and mutations rates for the populations; then press Plot. Press Clear to clear the graphs.
| Parameters | ||
| Number of Generations | 1-1000 | |
| Mutation Rate of Pop. X | 1-10% | |
| Mutation Rate of Pop. Y | 1-10% | |
The simulation begins with a single population. After the introduction of a geographic barrier, two lineages begin to diverge genetically. Mutations arise, introducing new alleles (represented by A and B) into the populations. As the new alleles become more prevalent in the populations, the two populations become less reproductively compatible. Reproductive incompatibility may arise at many loci, so the y-axis "frequency of alleles" represents an average frequency difference across many loci.
Set the number of generations to 200 and create plots with a mutation rate of 10% in each population, and then do it again with 1% mutations rates. How does the mutation rate affect the speed at which the populations become reproductively incompatible?


