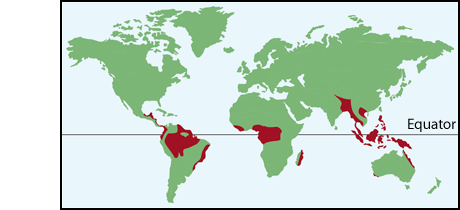
BIOMES

Biomes are groupings of ecologically similar organisms shaped by the environment in which
they are found. The distribution of terrestrial biomes is determined primarily by annual
patterns of temperature and precipitation. In this activity eight biomes are described (a subset of those shown above).
Click the buttons below to compare and contrast the features of these different terrestrial biomes.


The Walter climate diagrams above show the seasonal patterns of temperature and precipitation. Devised by the German biogeographers Heinrich Walter and Helmut Lieth, this graphic technique plots temperature and precipitation data in a simple way that visualizes a “growing season”—those months when average temperatures are above freezing (0°C) and when average precipitation is sufficient for plant growth. Walter climate diagrams are predicated on the “rule of thumb” that plant growth requires temperatures above 0°C and at least 2 mm of precipitation for each 1°C rise in temperature above 0°C.
Walter climate diagrams have two y-axis scales, one for temperature and one for precipitation; these axes align 0mm of precipitation with 0°C of temperature. The x axis shows 12 months, with the summer solstice placed in the center of the axis. When the precipitation curve falls below the temperature curve, yellow area (■), water availability limits plant growth. Blue shaded areas (■) represent subfreezing average monthly temperatures.
Walter climate diagrams have two y-axis scales, one for temperature and one for precipitation; these axes align 0mm of precipitation with 0°C of temperature. The x axis shows 12 months, with the summer solstice placed in the center of the axis. When the precipitation curve falls below the temperature curve, yellow area (■), water availability limits plant growth. Blue shaded areas (■) represent subfreezing average monthly temperatures.

Click an image to enlarge.