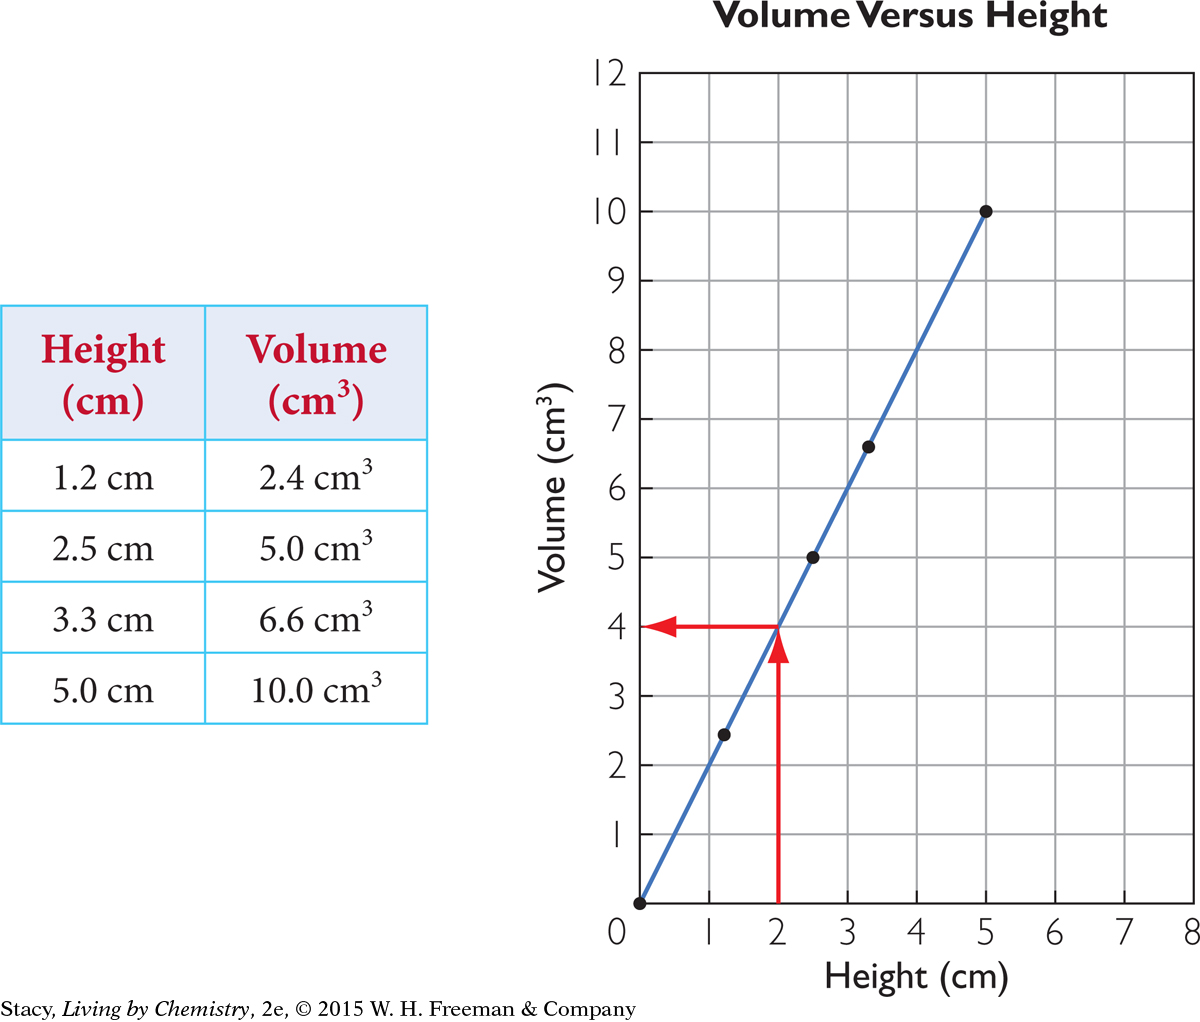
Using the Graph
You can use this graph to predict the volume of water corresponding to various heights of water in a rain gauge. Each point on the slanted line corresponds to a different volume and height.