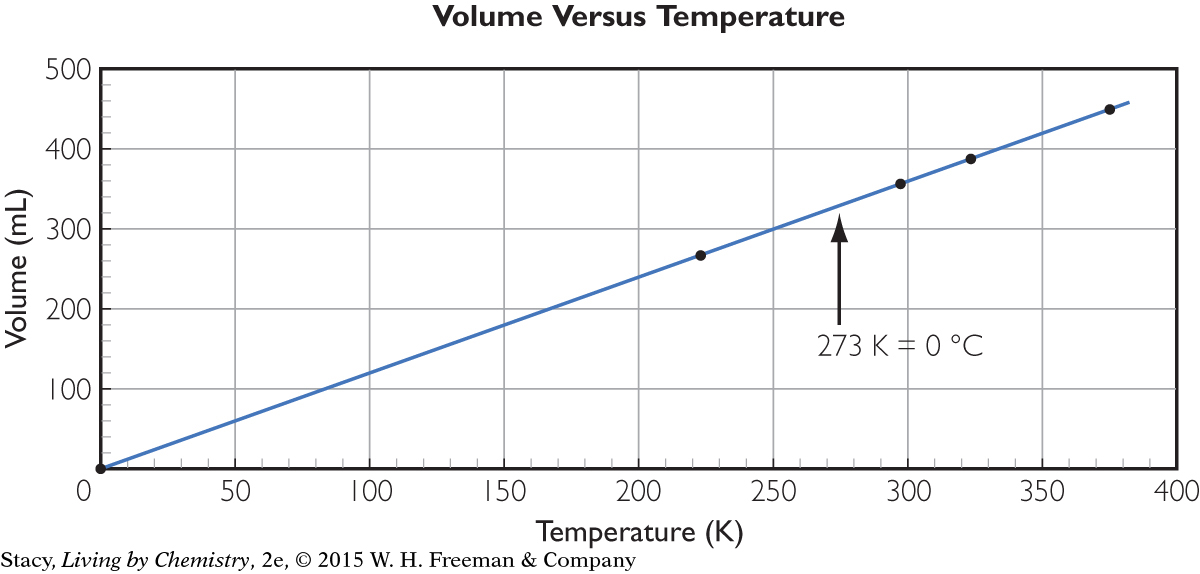
Using the Graph
The Kelvin scale sets the zero point at absolute zero. As a result, all temperatures are positive when they are expressed in kelvins. Notice that this graph is the same as the previous graph, but the x-axis has been shifted by 273. The value for 0 °C is 273 K.