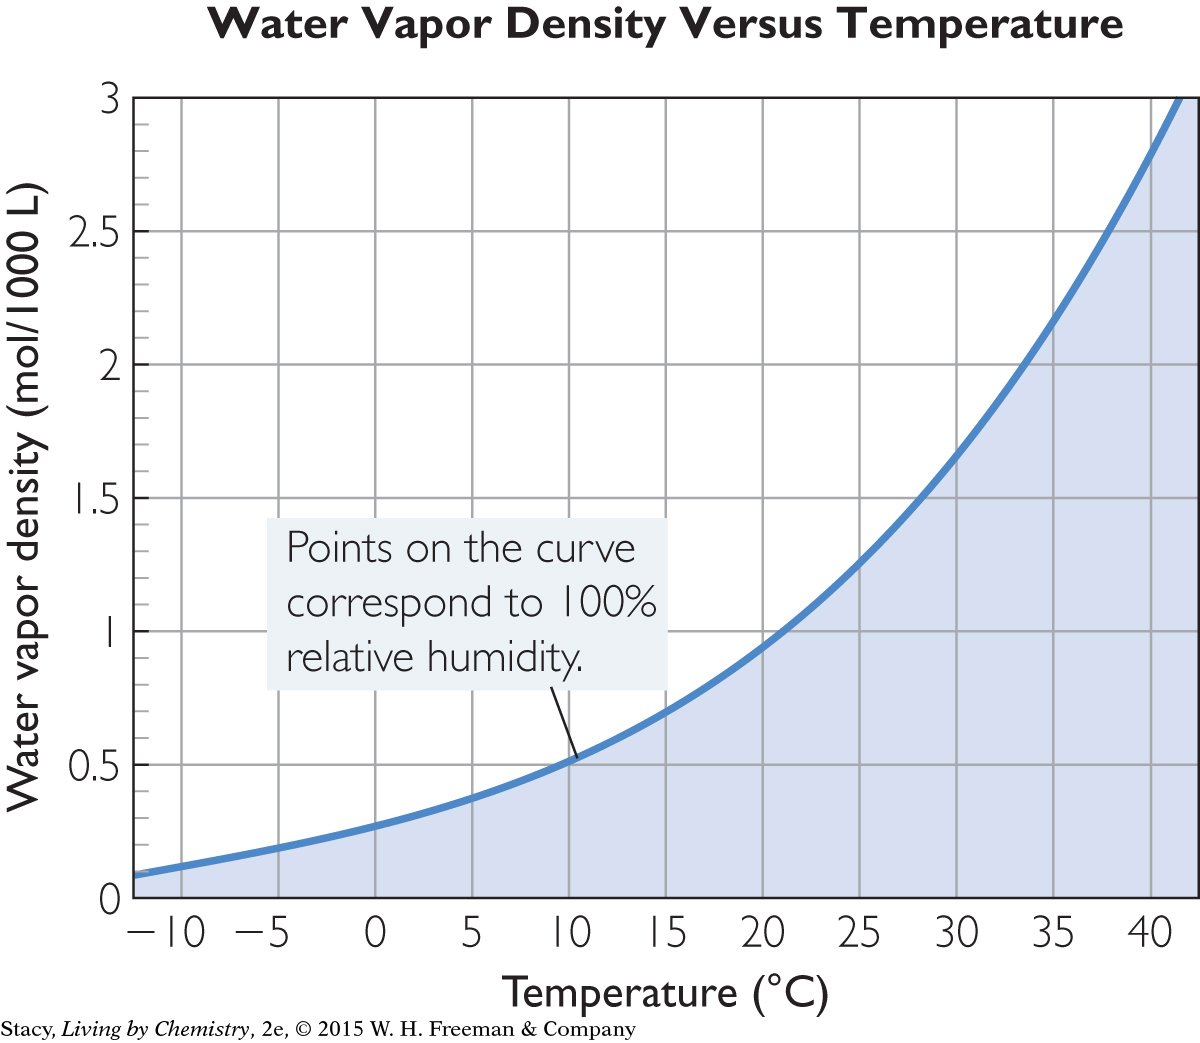
Using the Graph
This graph represents an inequality. The actual value for humidity can be any point on or below the curve. The graph shows that the total amount of water vapor that can be in the air increases with increasing temperature.