image
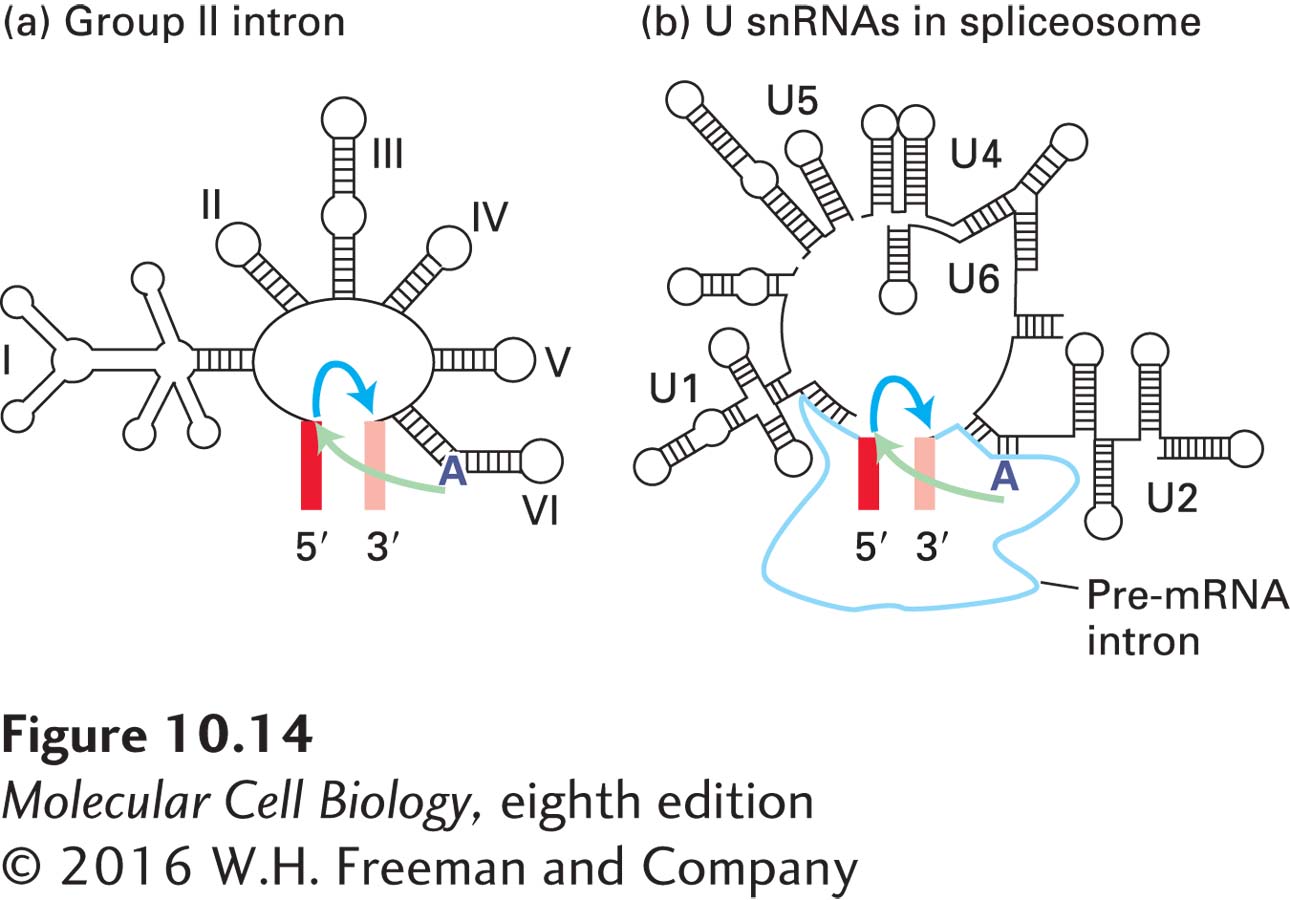
FIGURE 10-14 Comparison of group II self-splicing introns and the spliceosome. These schematic diagrams compare the secondary structures of (a) group II self-splicing introns and (b) U snRNAs present in the spliceosome. The first transesterification reaction is indicated by light green arrows; the second reaction, by blue arrows. The branch-point A is boldfaced. The similarity in these structures suggests that the spliceosomal snRNAs evolved from group II introns, and that the trans-acting snRNAs are functionally analogous to the corresponding domains in group II introns. The colored bars flanking the introns in (a) and (b) represent exons. See P. A. Sharp, 1991, Science 254:663.