image
FIGURE 11-12 Structural comparison of Na+/K+ ATPase and muscle Ca2+ ATPase. Three-dimensional structure of the Na+/K+ ATPase (gold) compared with that of the muscle Ca2+ ATPase (purple), as seen from the cytoplasmic surface. αM1–αM10 denote the 10 membrane-spanning α helices of the Na+/K+ ATPase.
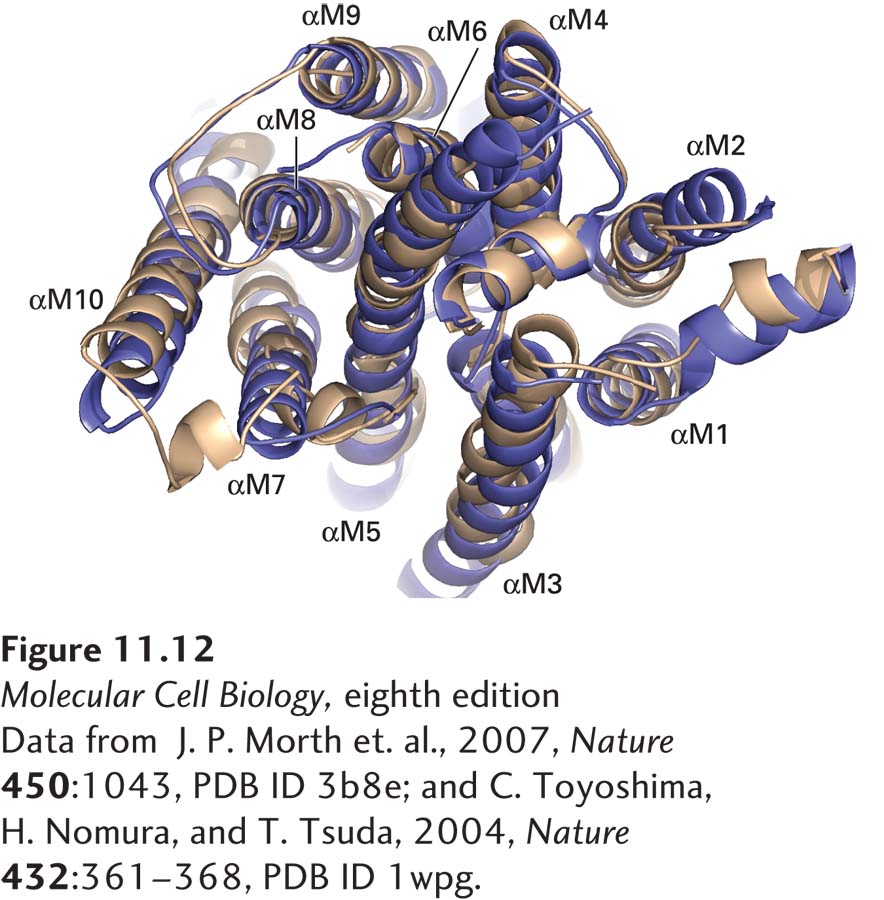
[Data from J. P. Morth et al., 2007, Nature 450:1043, PDB ID 3b8e; and C. Toyoshima, H. Nomura, and T. Tsuda, 2004, Nature 432:361–368, PDB ID 1wpg.]