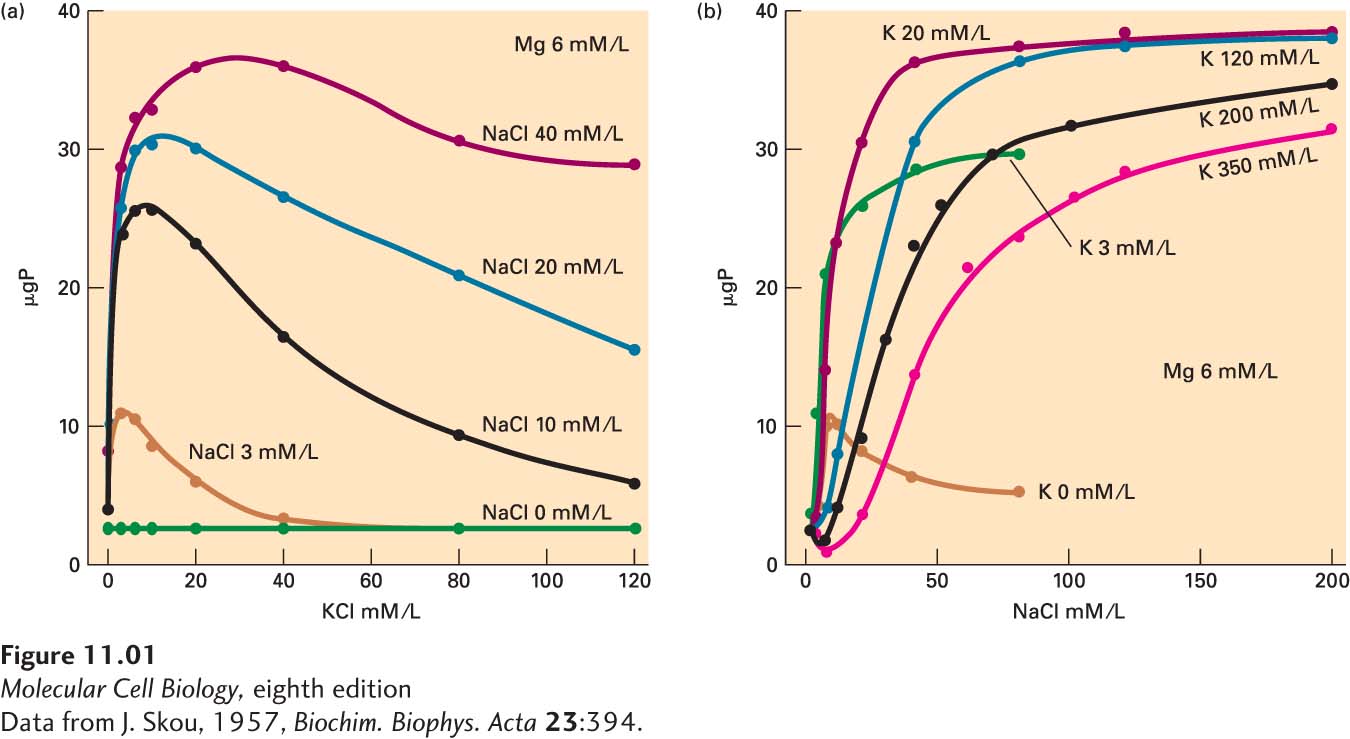
FIGURE 1 Demonstration of the dependence of Na+/K+ ATPase activity on the concentration of each ion. (a) Increasing K+ leads to inhibition of the ATPase activity. (b) With increasing Na+, the enzyme activity increases up to a peak and then levels out. This graph also demonstrates the dependence of the activity on low levels of K+.
[Data from J. Skou, 1957, Biochim. Biophys. Acta 23:394.]