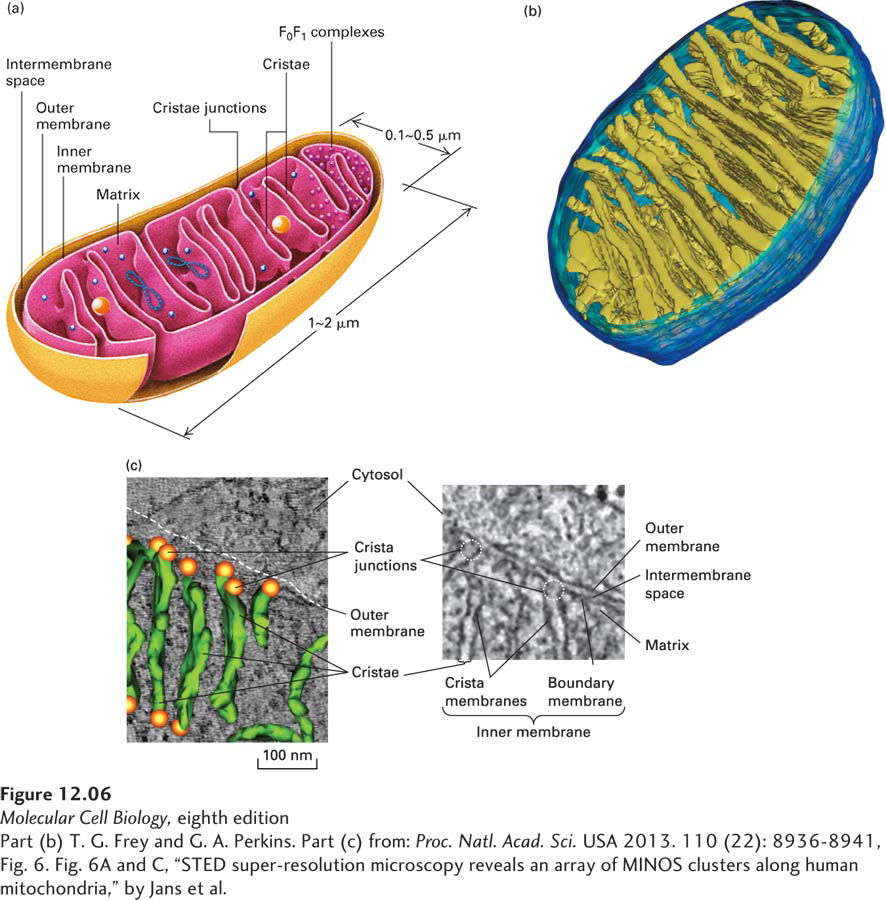
FIGURE 12- 6 Internal structure of a mitochondrion. (a) Schematic diagram showing the principal membranes and compartments. The smooth outer membrane forms the outside boundary of the mitochondrion. The inner membrane is apparently a single continuous membrane that has three distinct domains: boundary membrane, cristae, and crista junctions. The boundary membrane is flat and lies immediately below and adjacent to the outer membrane. The cristae are sheet- like and tubelike invaginations that extend from the boundary membrane into the center of the mitochondrion. The sharp bends that form the connection between the boundary membrane and the cristae are called crista junctions. The intermembrane space is continuous with the lumen of each crista. The F0F1 complexes (small red spheres), which synthesize ATP, are intramembrane particles that protrude from the cristae and inner membrane into the matrix. The matrix contains the mitochondrial DNA (blue strands), ribosomes (small blue spheres), and granules (large yellow spheres). (b) Computer- generated model of a section of a mitochondrion from chicken brain. This model is based on a three- dimensional electron microscopic image calculated from a series of two- dimensional electron micrographs recorded at regular intervals. This technique is analogous to a three- dimensional x- ray tomogram or CAT scan used in medical imaging. Note the tightly packed cristae (yellow- green), the inner membrane (light blue), and the outer membrane (dark blue). (c) Cristae and crista junctions from human fibroblasts were visualized and modeled using electron microscopy and tomography. The right panel shows one of the multiple sections through the mitochondrion imaged using transmission electron microscopy, with the mitochondrial membranes clearly distinguished. The sharp bends in the inner membrane at the junctions (dotted circles) that separate the crista membranes from the inner boundary membrane are seen clearly. The left panel shows a three- dimensional tomographic model of the laminar cristae seen edge on (green) and crista junctions (orange spheres) overlaid with the EM image.
[Part (b) T. G. Frey and G. A. Perkins. Part (c) from: Proc. Natl. Acad. Sci. USA 2013. 110 (22): 8936- 8941, Fig. 6. Fig. 6A and C, “STED super- resolution microscopy reveals an array of MINOS clusters along human mitochondria,” by Jans et al.]
[Leave] [Close]