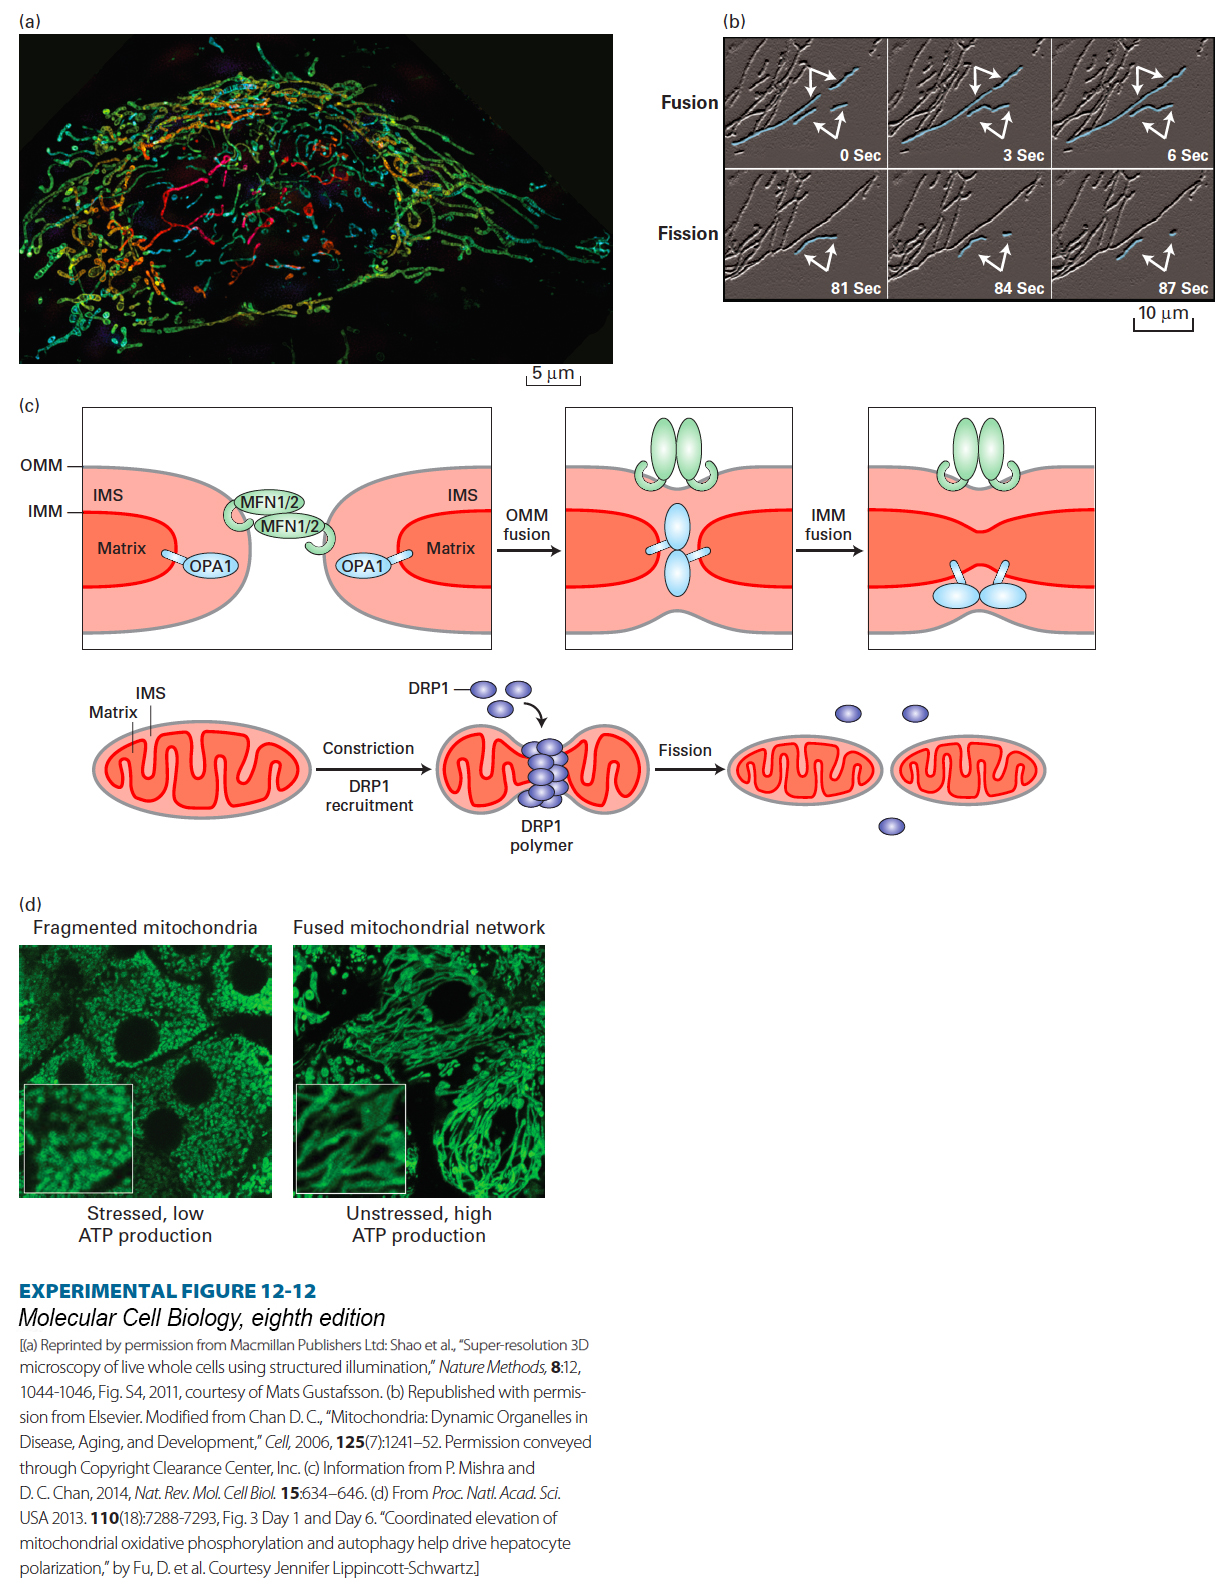
image
EXPERIMENTAL FIGURE 12-12 Mitochondria undergo rapid fusion and fission. (a) A human HeLa cell labeled with a mitochondrion-specific fluorescent dye (MitoTracker Green) was imaged using three-dimensional structured illumination fluorescence microscopy (a 6.1-µm-thick section through the cell is shown). The network of fused and branched mitochondria is seen in the cytoplasm, with only a few mitochondria observed above or below the nucleus (unstained central dark oval). The identity of the striations seen within the mitochondria is not known. The mitochondria are shown in artificial colors to indicate their positions relative to the surface to which the cell is attached (blue is closest to and red farthest from the surface). (b) Mitochondria labeled with a fluorescent protein in a live normal mouse embryonic fibroblast were observed using time-lapse fluorescence microscopy. Several mitochondria undergoing fusion (top) or fission (bottom) are artificially highlighted in blue and with arrows. (c) Mitochondrial fusion (top) and fission (bottom) are mediated by a set of GTPase enzymes (MFN1, MFN2, OPA1, and DRP1). The integral membrane proteins MFN1 and MFN2 (MFN1/2) mediate outer mitochondrial membrane (OMM) fusion, which is followed by fusion of the inner mitochondrial membranes (IMM) mediated by the integral membrane protein OPA1. The matrix and inner membrane space (IMS) remain distinct. The soluble cytosolic GTPase DRP1 is recruited to a constricted site on the surface of a mitochondrion, where DRP1 polymers sever the membrane, resulting in fission. A variety of post-translational modifications of DRP1 regulate fission. (d) (Left) Rat liver cells (hepatocytes) one day after being removed from the liver and placed in cell culture, are stressed and depolarized (lack some of the morphological and biochemical properties of epithelial cells; see Chapter 20), have low levels of oxidative phosphorylation and ATP production, and have fragmented mitochondria (visualized by staining with MitoTracker Green). (Right) After growth in culture for six days, the hepatocytes become polarized, their mitochondria fuse, forming an extensive network, and the cells exhibit high levels of oxidative phosphorylation and ATP production. Insets show higher-magnification views of the mitochondria.
[(a) Reprinted by permission from Macmillan Publishers Ltd: Shao et al., “Super-resolution 3D microscopy of live whole cells using structured illumination,” Nature Methods, 8:12, 1044-1046, Fig. S4, 2011, courtesy of Mats Gustafsson. (b) Republished with permission from Elsevier. Modified from Chan D. C., “Mitochondria: Dynamic Organelles in Disease, Aging, and Development,” Cell, 2006, 125(7):1241–52. Permission conveyed through Copyright Clearance Center, Inc. (c) Information from P. Mishra and D. C. Chan, 2014, Nat. Rev. Mol. Cell Biol. 15:634–646. (d) From Proc. Natl. Acad. Sci. USA 2013. 110(18):7288-7293, Fig. 3 Day 1 and Day 6. “Coordinated elevation of mitochondrial oxidative phosphorylation and autophagy help drive hepatocyte polarization,” by Fu, D. et al. Courtesy Jennifer Lippincott-Schwartz.]